In this exercise, we will look at some of the things we can do with a modem trace, and some of the information we can learn from it.
The exercise uses a trace taken from the application in Lesson 7 Exercise 1 and can be found here: l7/cellfund_less7_exer2.pcapng, of whichever version directory you are using.
However, you should be able to follow the exercise with a trace you have taken yourself as well. Just be aware that packet numbers and the content of some of the packets will be different from what we show here.
Exercise Steps
1. Install Wireshark.
For this exercise, you will need Wireshark installed on your computer.
1.1 In Cellular Monitor, enable the “Open in Wireshark” option under Trace Options. This will prompt the app to check if you already have Wireshark installed, and if you don’t, it will provide the Wireshark install link.
1.2 Click on Install Wireshark and select the download link for your OS.
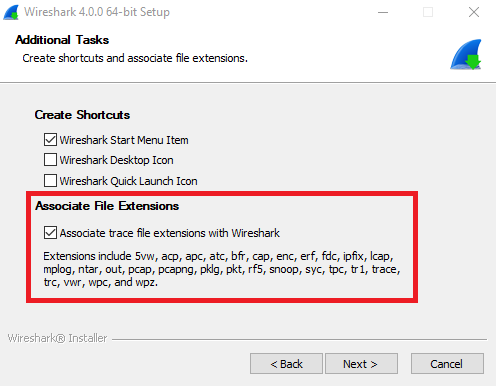
1.3 Follow the instructions on the screen to download Wireshark with all the default settings.
Make sure the box “Associate trace file extensions with Wireshark” is checked.
2. Open the trace file from the previous exercise in Wireshark.
2.1 In Cellular Monitor, disconnect from your device by selecting the little icon next to the device name in the upper left hand corner.
2.2 Under File Actions, click on Open trace file in Wireshark… and select the trace file we took in the previous exercise. It will be the one most recently modified and with the most recent time stamp in its name. Then select Open.
This will convert the trace into a PCAP file and open it in Wireshark.
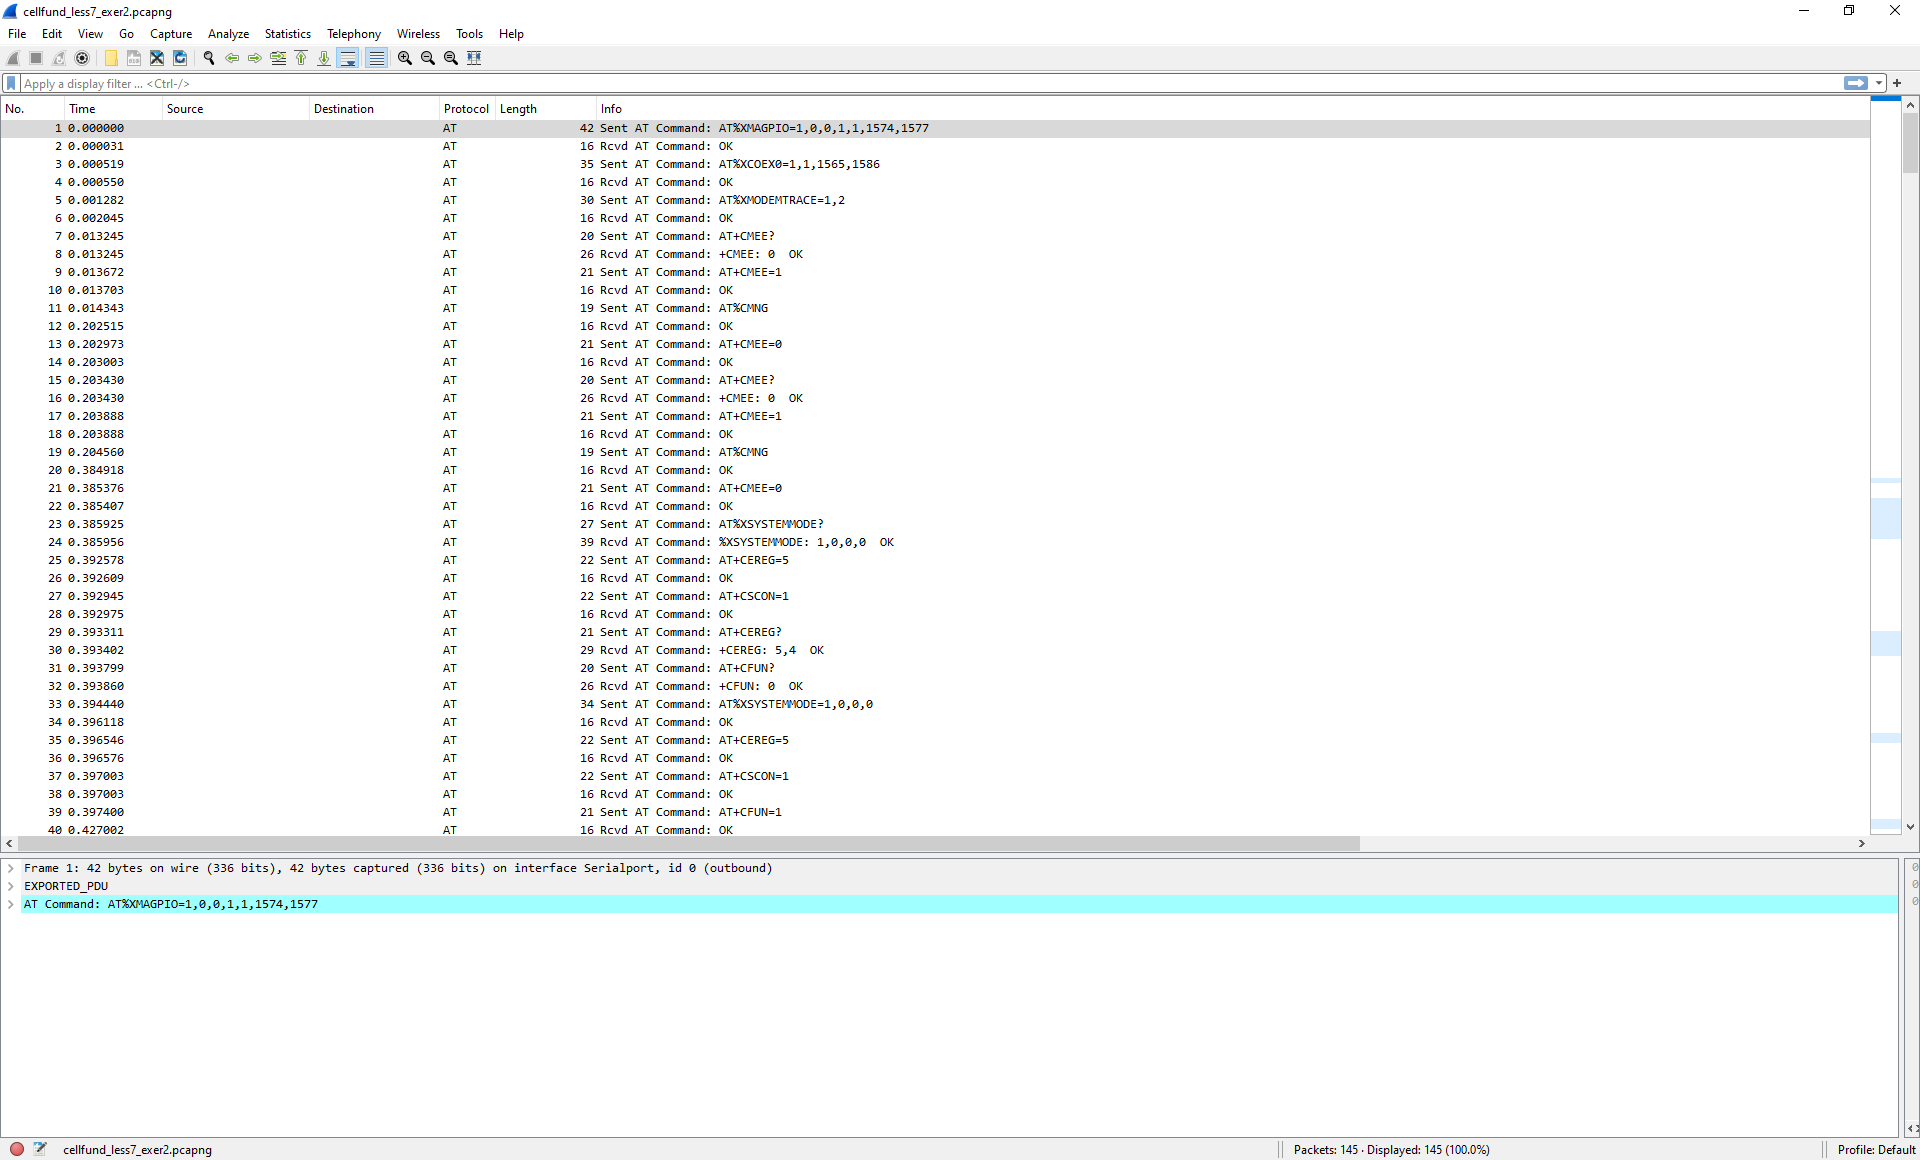
In the main window, you will see a list of lines, which are all the packets captured in the modem trace.
If you click on one of the packets, you can see more details about the packet, the fields in the packet, and the payload in the window at the bottom of the screen.
Modem trace in Wireshark
Scrolling through the trace, we can observe that are roughly split into three categories: AT commands, LTE traffic, and IP traffic. All three packet types are useful, but if you are debugging a problem with the IP traffic for instance, the rest can be a distraction, as you can get a lot of LTE packets between the IP packets we are interested in.
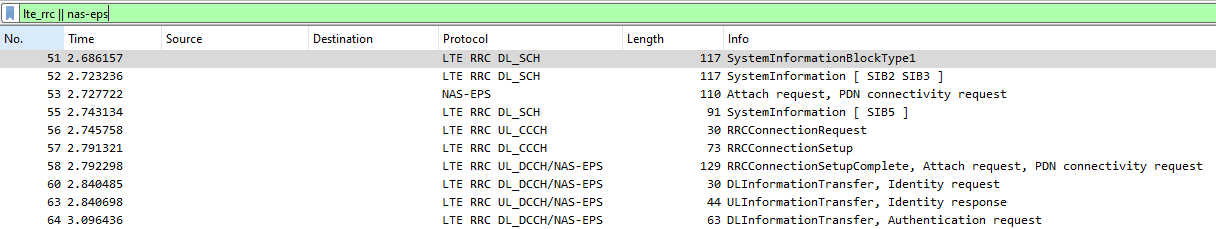
3. Use the filter function to show only LTE traffic packets.
In the filter toolbar, located over the list of packets, type in
lte_rrc || nas-eps
Wireshark
lte_rrc indicates the packets that are sent between the eNB and the modem, while nas-eps represents the packets sent between the modem and the core network (EPC), beyond the eNB.
Recall
Recall from lesson 1 that the eNB (Evolved Node B) is the hardware connected to the cellular network that communicates directly with the UE’s. These are commonly referred to as “base stations” or “cell towers”.
For example, the attach request sent by the UE to initiate the attach procedure is an example of such a message.
Notice that as you start typing, you will get suggestions on what categories you can filter by.
4. Identify the packets sent during the network attach procedure.
One of the interesting parts of the LTE traffic is when the device connects to the eNB. The trace starts with an Attach request from the UE of type NAS-EPS and ends with an Attach complete from the UE of type NAS-EPS.
In the trace shown here, the network attach is found in packets 53 to 78.
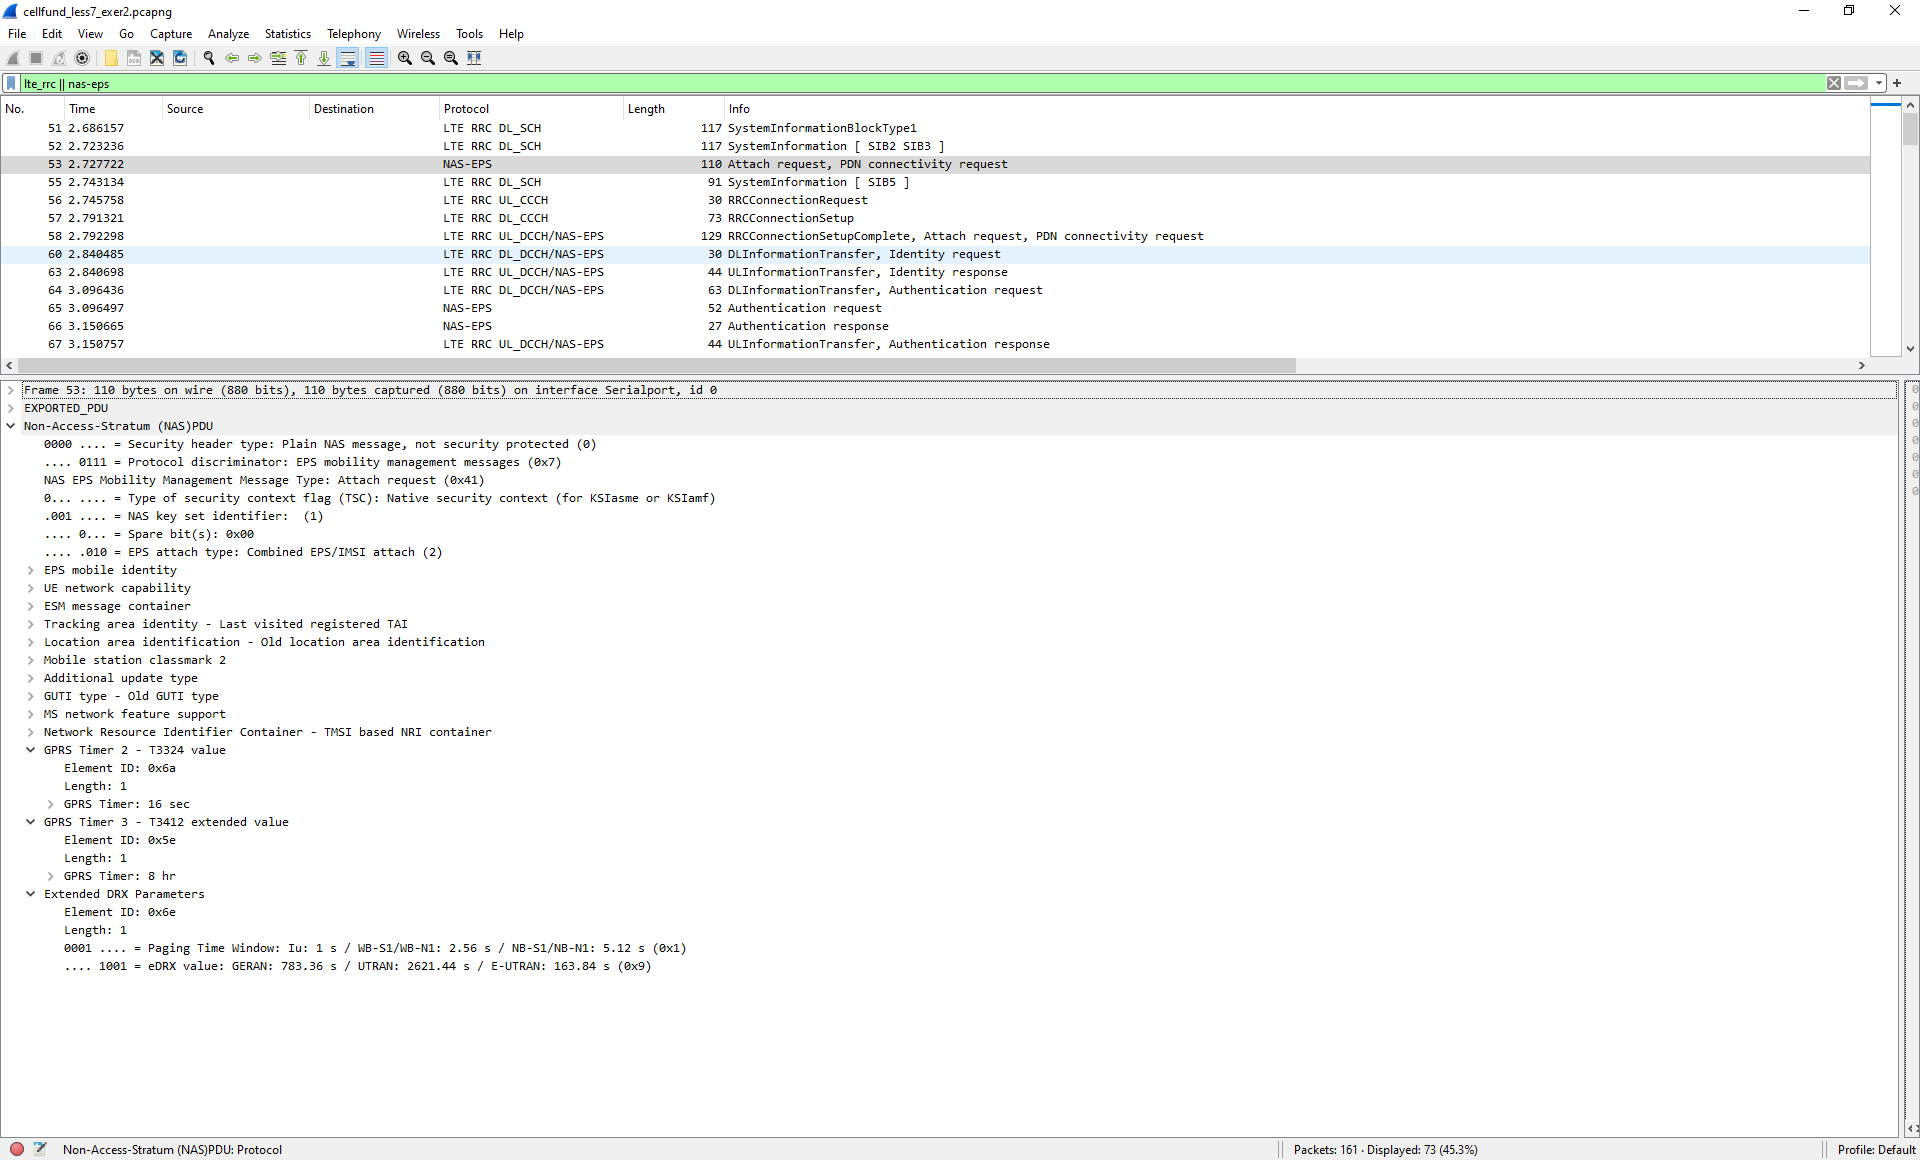
5. Investigate the packet containing the Attach request.
Click on the “Attach request”, in this case packet 53, to see more details about the packet in the packet window below. By expanding some of the fields, we see that the device requests PSM with a Periodic TAU of 8 hours, and an Active Time of 16 seconds, as well as eDRX with an eDRX Cycle of 163.84 seconds.
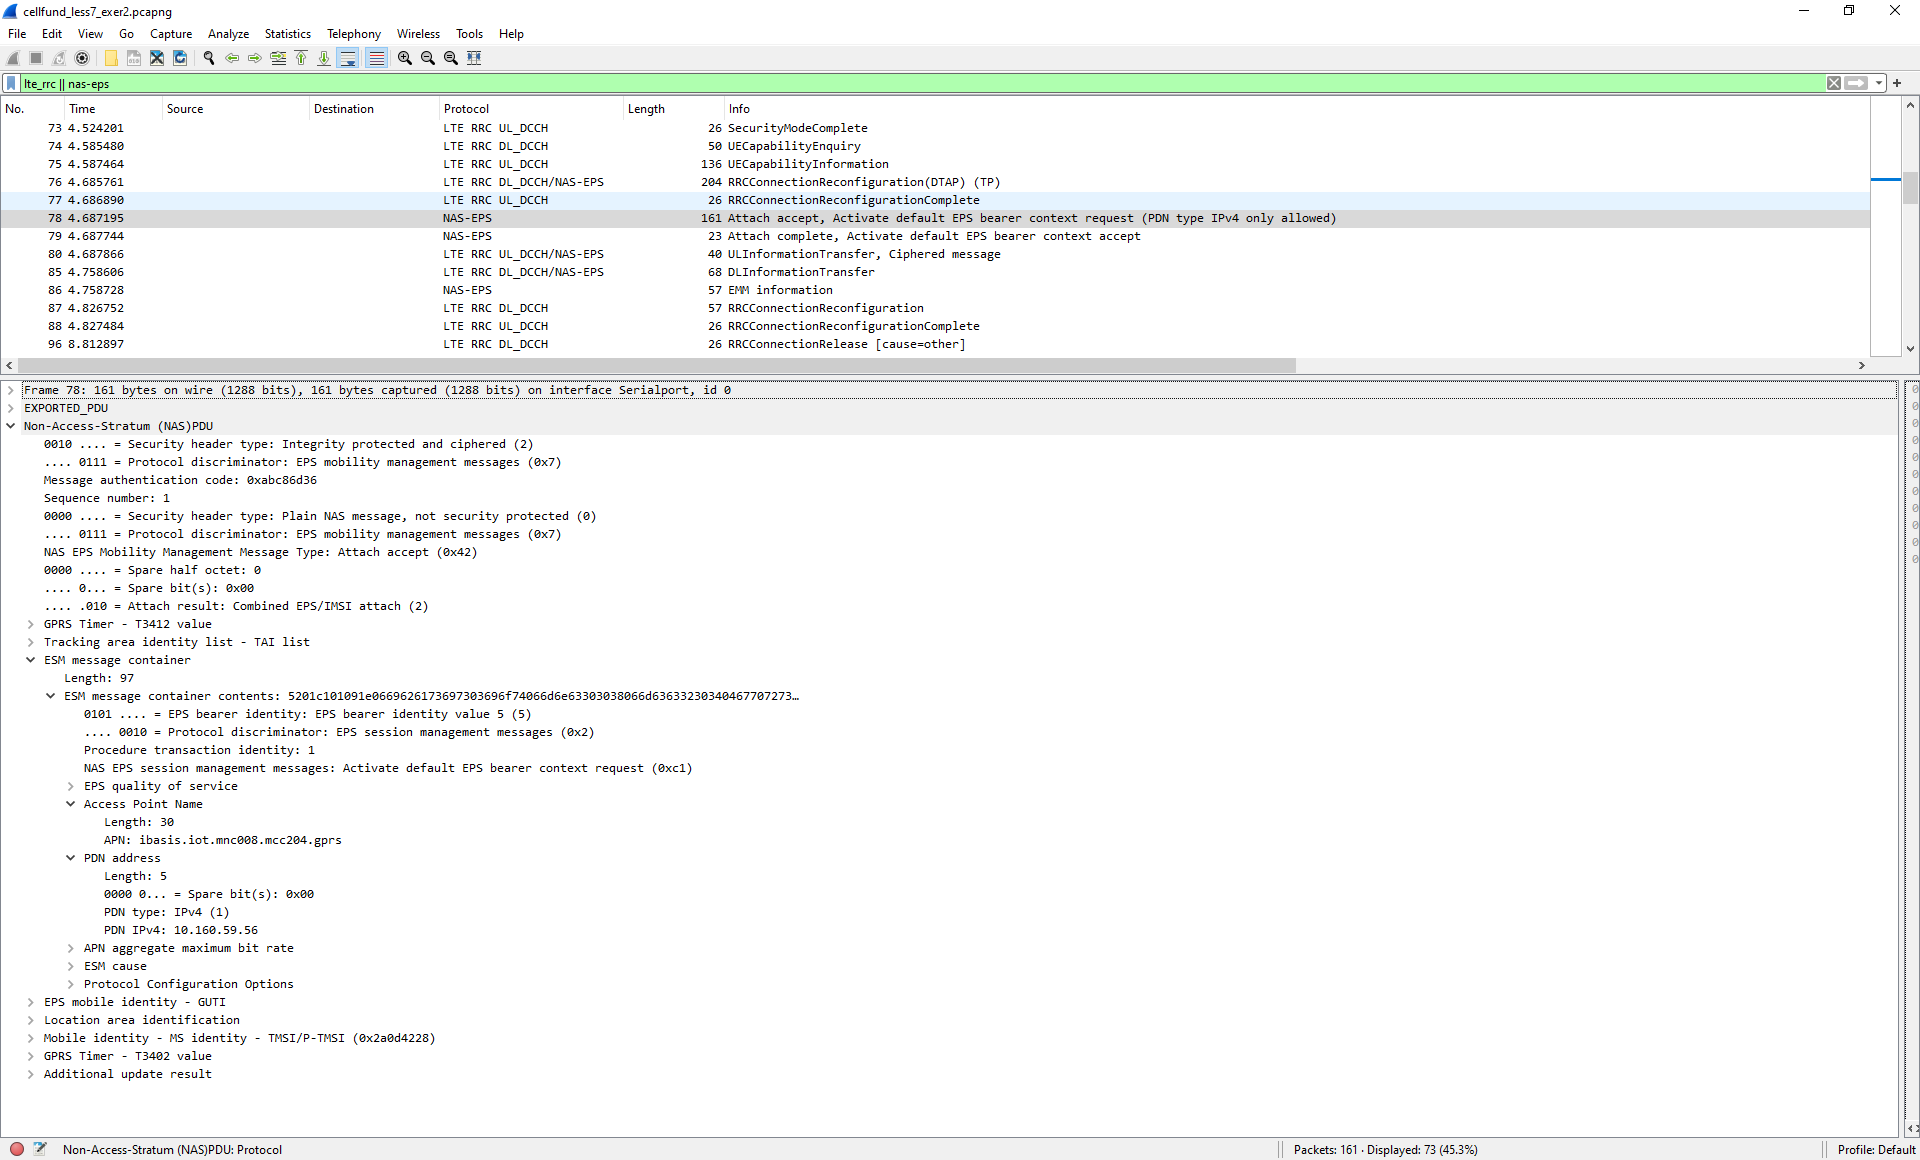
6. Investigate the packet containing the Attach accept.
If we now look at the “Attach accept”, in this case packet 78, which is sent from the core network to the UE, we can see the result of the network attach. One thing to notice here is that we don’t see the PSM and eDRX related fields we had in the Attach request. This means that we got neither PSM nor eDRX granted by the network. Other useful information we can find in the “Attach accept” packet is the APN the device is connected to, and the IP address it is allocated.
7. Use the filter function to show only the IP traffic.
In the filter toolbar, located over the list of packets, type in
ip
Wireshark
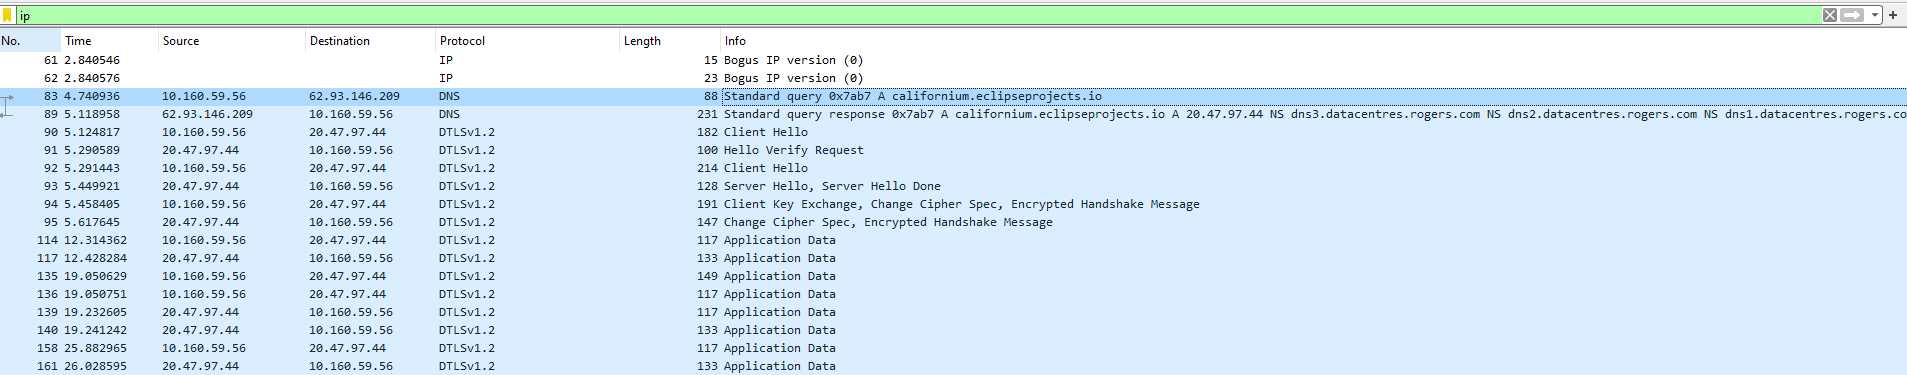
8. Identify the DNS lookup, DTLS handshake and the encrypted application data
In this trace, the IP traffic can be split into 3 parts:
DNS lookup (packets 83-89)
DTLS handshake (packets 90-95)
Encrypted application data (packets 114-161).
We also have another way of finding the IP address of the device: We know that the DNS query and the Client Hello DTLS packet are sent from the device. So the source address in those packets will be the IP address of the device. If we compare this address (10.160.59.56) with the one we found in the Attach accept packet, we see that they match.
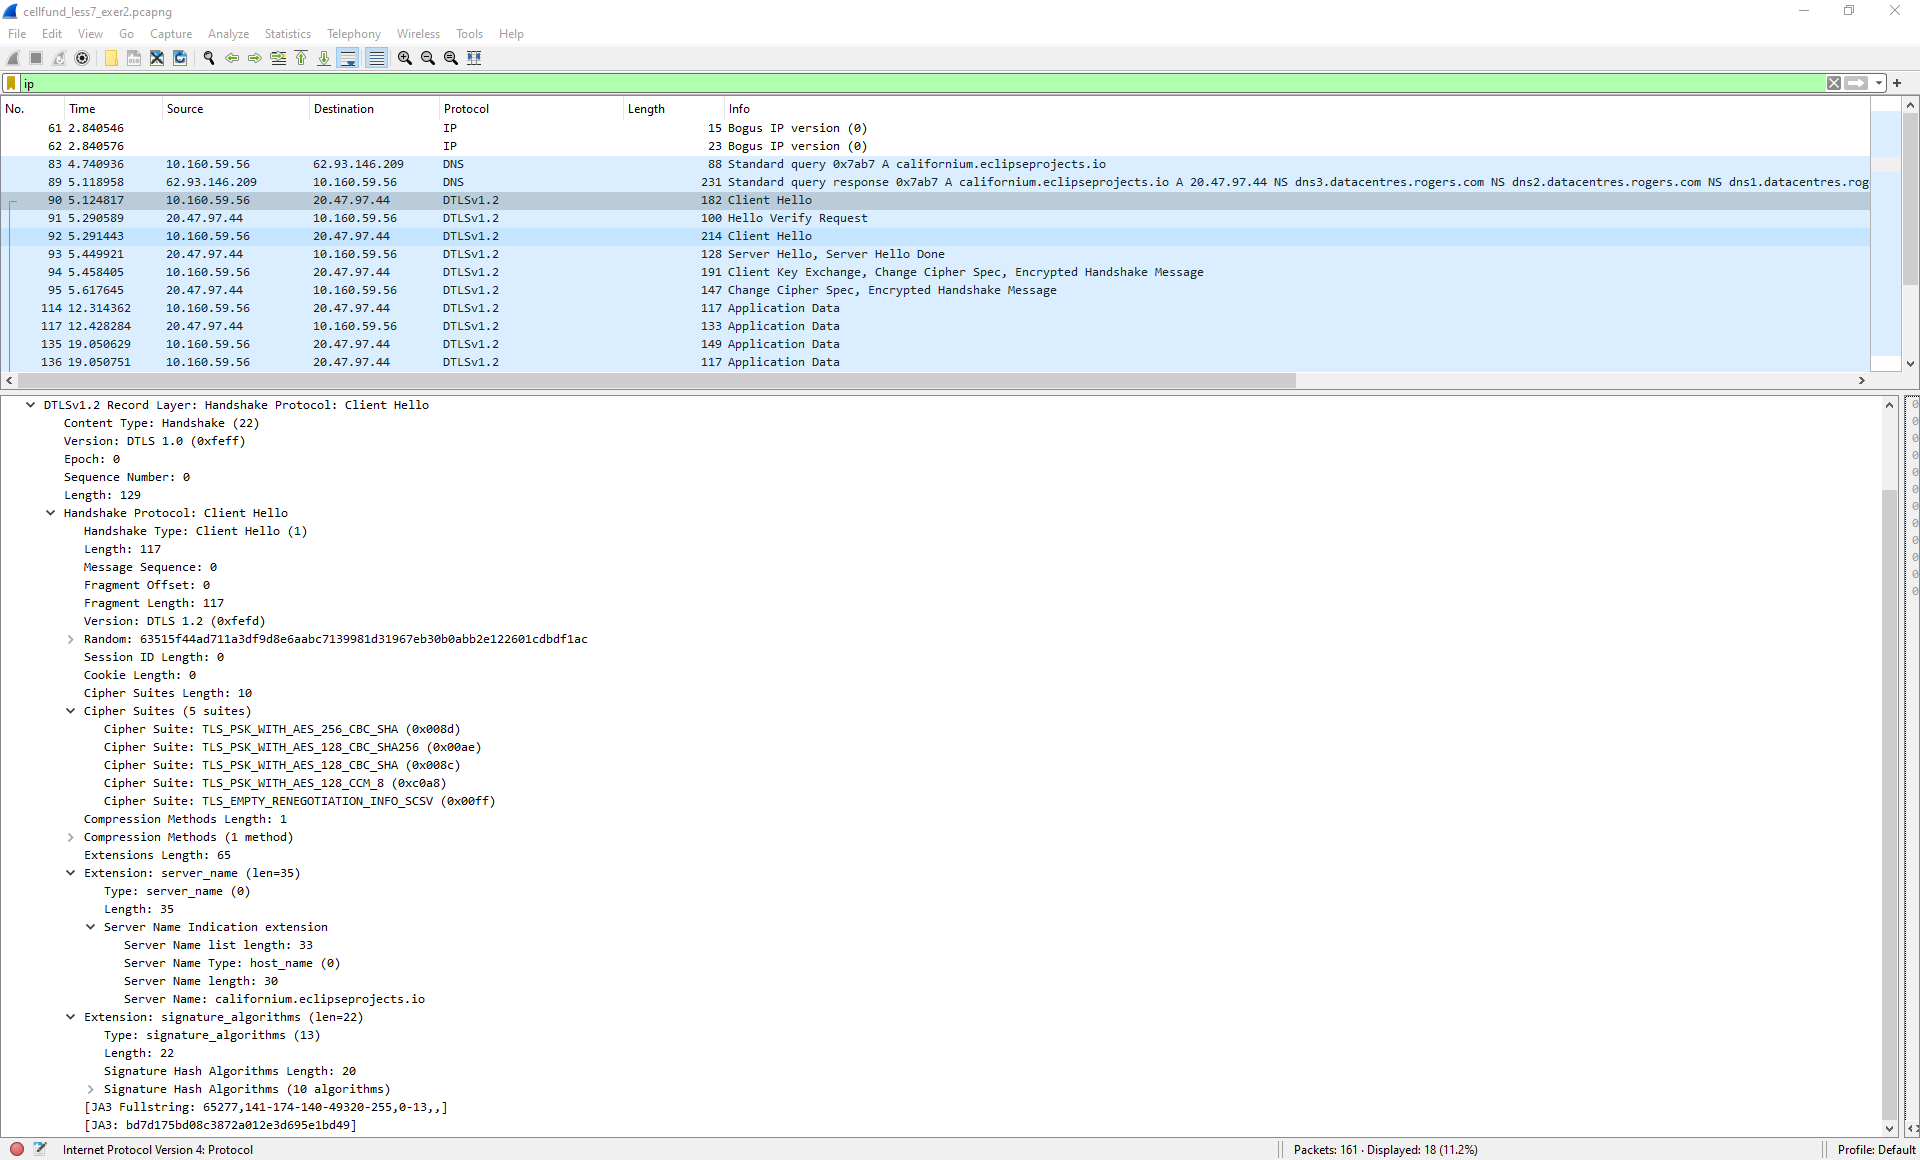
Looking at these three scenarios is very useful when debugging issues where the device is not able to connect to a server. And often, the most interesting packet is the Client Hello packet (90). This is the first packet sent from the device to the server, and includes a lot of details about what the device supports. In our case, we see that it is using PSK as the authentication and encryption method, and that it wants to connect to the server called callifornium.eclipseprojects.io.
10. Decode further by providing Wireshark with the pre-shared key (PSK).
The DTLS handshake ends with an “Encrypted Handshake Message” in packet 95, and after that, we only see encrypted application data. However, by providing the PSK used in the DTLS connection to Wireshark, we can decode the traffic.
More on this
It is only possible to decrypt the traffic in the trace when using PSK-based cipher suites. When using a cipher suite using asymmetric keys, a symmetric key is generated and shared using a Diffie-Hellman exchange. Because the modem does not output the symmetric key used, it is not possible to decrypt the traffic.
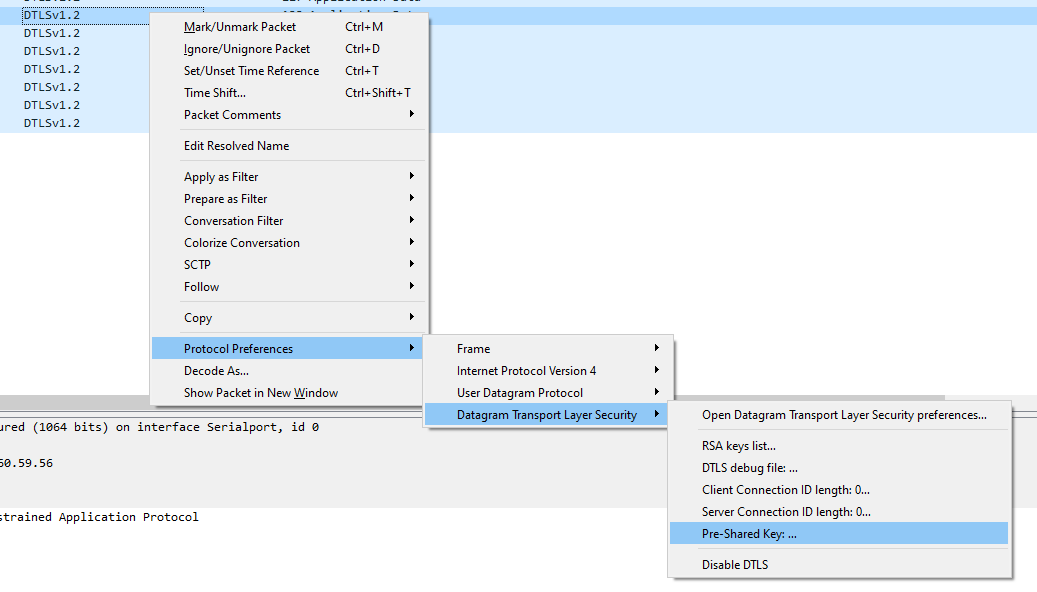
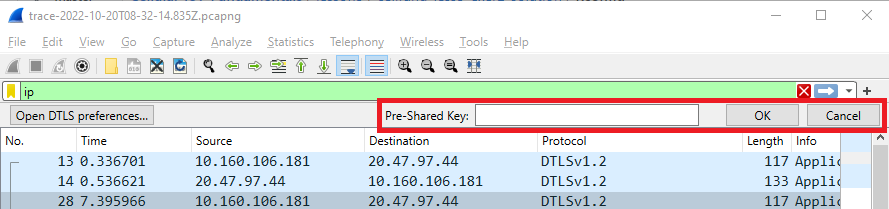
10.1 Right-click on any of the DTLS packets, then select Protocol Preferences -> Datagram Transport Layer Security -> Pre-Shared Key.
10.2 You now have a new toolbar below the filter toolbar, where you can enter the PSK.
Copy the PSK from the Kconfig in the application, COAP_SERVER_PSK. Enter it in the Pre-Shared key bar that appeared in press OK.
11. Observe the unencrypted application data packets
Nordic Developer Academy Privacy Policy
1. IntroductionÂ
In this Privacy Policy you will find information on Nordic Semiconductor ASA (“Nordic Semiconductorâ€) processes your personal data when you use the Nordic Developer Academy.
References to “we†and “us†in this document refers to Nordic Semiconductor.
2. Our processing of personal data when you use the Nordic Developer AcademyÂ
2.1 Nordic Developer AcademyÂ
Nordic Semiconductor processes personal data in order to provide you with the features and functionality of the Nordic Developer Academy. Creating a user account is optional, but required if you want to track you progress and view your completed courses and obtained certificates. If you choose to create a user account, we will process the following categories of personal data:
Email
Name
Password (encrypted)
Course progression (e.g. which course you have completely or partly completed)
Certificate information, which consists of name of completed course and the validity of the certificate
Course results
During your use of the Nordic Developer Academy, you may also be asked if you want to provide feedback. If you choose to respond to any such surveys, we will also process the personal data in your responses in that survey.
The legal basis for this processing is GDPR article 6 (1) b. The processing is necessary for Nordic Semiconductor to provide the Nordic Developer Academy under the Terms of Service.
2.2 AnalyticsÂ
If you consent to analytics, Nordic Semiconductor will use Google Analytics to obtain statistics about how the Nordic Developer Academy is used. This includes collecting information on for example what pages are viewed, the duration of the visit, the way in which the pages are maneuvered, what links are clicked, technical information about your equipment. The information is used to learn how Nordic Developer Academy is used and how the user experience can be further developed.
2.2 NewsletterÂ
You can consent to receive newsletters from Nordic from within the Nordic Developer Academy. How your personal data is processed when you sign up for our newsletters is described in the Nordic Semiconductor Privacy Policy.
3. Retention periodÂ
We will store your personal data for as long you use the Nordic Developer Academy. If our systems register that you have not used your account for 36 months, your account will be deleted.
4. Additional informationÂ
Additional information on how we process personal data can be found in the Nordic Semiconductor Privacy Policy and Cookie Policy.
â€â€Â
Nordic Developer Academy Terms of Service
1. Introduction
â€These terms and conditions (“Terms of Useâ€) apply to the use of the Nordic Developer Academy, provided by Nordic Semiconductor ASA, org. nr. 966 011 726, a public limited liability company registered in Norway (“Nordic Semiconductorâ€). â€
Nordic Developer Academy allows the user to take technical courses related to Nordic Semiconductor products, software and services, and obtain a certificate certifying completion of these courses. By completing the registration process for the Nordic Developer Academy, you are agreeing to be bound by these Terms of Use.
These Terms of Use are applicable as long as you have a user account giving you access to Nordic Developer Academy.â€
â€2. Access to and use of Nordic Developer Academy
â€â€Upon acceptance of these Terms of Use you are granted a non-exclusive right of access to, and use of Nordic Developer Academy, as it is provided to you at any time. Nordic Semiconductor provides Nordic Developer Academy to you free of charge, subject to the provisions of these Terms of Use and the Nordic Developer Academy Privacy Policy.
To access select features of Nordic Developer Academy, you need to create a user account. You are solely responsible for the security associated with your user account, including always keeping your login details safe.
You will able to receive an electronic certificate from Nordic Developer Academy upon completion of courses. By issuing you such a certificate, Nordic Semiconductor certifies that you have completed the applicable course, but does not provide any further warrants or endorsements for any particular skills or professional qualifications.
Nordic Semiconductor will continuously develop Nordic Developer Academy with new features and functionality, but reserves the right to remove or alter any existing functions without notice.
â€3. Acceptable use
You undertake that you will use Nordic Developer Academy in accordance with applicable law and regulations, and in accordance with these Terms of Use.†You must not modify, adapt, or hack Nordic Developer Academy or modify another website so as to falsely imply that it is associated with Nordic Developer Academy, Nordic Semiconductor, or any other Nordic Semiconductor product, software or service.
You agree not to reproduce, duplicate, copy, sell, resell or in any other way exploit any portion of Nordic Developer Academy, use of Nordic Developer Academy, or access to Nordic Developer Academy without the express written permission by Nordic Semiconductor. You must not upload, post, host, or transmit unsolicited email, SMS, or \”spam\” messages.
You are responsible for ensuring that the information you post and the content you share does not;
contain false, misleading or otherwise erroneous information
infringe someone else’s copyrights or other intellectual property rights
contain sensitive personal data or
contain information that might be received as offensive or insulting.
Such information may be removed without prior notice.
â€Nordic Semiconductor reserves the right to at any time determine whether a use of Nordic Developer Academy is in violation of its requirements for acceptable use.
Violation of the at any time applicable requirements for acceptable use may result in termination of your account. We will take reasonable steps to notify you and state the reason for termination in such cases.
â€4. Routines for planned maintenance
â€Certain types of maintenance may imply a stop or reduction in availability of Nordic Developer Academy. Nordic Semiconductor does not warrant any level of service availability but will provide its best effort to limit the impact of any planned maintenance on the availability of Nordic Developer Academy.
5. Intellectual property rights
â€Nordic Semiconductor retains all rights to all elements of Nordic Developer Academy. This includes, but is not limited to, the concept, design, trademarks, know-how, trade secrets, copyrights and all other intellectual property rights.
Nordic Semiconductor receives all rights to all content uploaded or created in Nordic Developer Academy. You do not receive any license or usage rights to Nordic Developer Academy beyond what is explicitly stated in this Agreement.
â€6. Liability and damages
â€Nothing within these Terms of Use is intended to limit your statutory data privacy rights as a data subject, as described in the Nordic Developer Academy Privacy Policy. â€You acknowledge that errors might occur from time to time and waive any right to claim for compensation as a result of errors in Nordic Developer Academy. When an error occurs, you shall notify Nordic Semiconductor of the error and provide a description of the error situation.
You agree to indemnify Nordic Semiconductor for any loss, including indirect loss, arising out of or in connection with your use of Nordic Developer Academy or violations of these Terms of Use. â€Nordic Semiconductor shall not be held liable for, and does not warrant that (i) Nordic Developer Academy will meet your specific requirements, (ii) Nordic Developer Academy will be uninterrupted, timely, secure, or error-free, (iii) the results that may be obtained from the use of Nordic Developer Academy will be accurate or reliable, (iv) the quality of any products, services, information, or other material purchased or obtained by you through Nordic Developer Academy will meet your expectations, or that (v) any errors in Nordic Developer Academy will be corrected.
You accept that this is a service provided to you without any payment and hence you accept that Nordic Semiconductor will not be held responsible, or liable, for any breaches of these Terms of Use or any loss connected to your use of Nordic Developer Academy. Unless otherwise follows from mandatory law, Nordic Semiconductor will not accept any such responsibility or liability.
â€7. Change of terms
â€Nordic Semiconductor may update and change the Terms of Use from time to time. Nordic Semiconductor will seek to notify you about significant changes before such changes come into force and give you a possibility to evaluate the effects of proposed changes. Continued use of Nordic Developer Academy after any such changes shall constitute your acceptance of such changes. You can review the current version of the Terms of Use at any time at https://academy.nordicsemi.com/terms-of-service/
â€8. Transfer of rights
â€Nordic Semiconductor is entitled to transfer its rights and obligation pursuant to these Terms of Use to a third party as part of a merger or acquisition process, or as a result of other organizational changes.
â€9. Third Party Services
â€â€To the extent Nordic Developer Academy facilitates access to services provided by a third party, you agree to comply with the terms governing such third party services. Nordic Semiconductor shall not be held liable for any errors, omissions, inaccuracies, etc. related to such third party services.
â€10. Dispute resolution
â€â€The Terms of Use and any other legally binding agreement between yourself and Nordic Semiconductor shall be subject to Norwegian law and Norwegian courts’ exclusive jurisdiction.
Switch language?
Progress is tracked separately for each language. Switching will continue from your progress in that language or start fresh if you haven't begun.
Your current progress is saved, and you can switch back anytime.
•This release includes Long-Term Support (LTS) for five years.
•Patch (minor) releases will address security vulnerabilities and critical bug fixes.
•API stability is guaranteed; breaking changes are only introduced when required by a security fix.
•Notifications for critical bug fixes and security updates via the myNordic notification system (mynordic.nordicsemi.com)
MCUboot & Partition Manager
•Single-Slot DFU and RAM Load mode are both promoted to fully supported •Partition Manager is officially deprecated in favor of Zephyr's devicetree-based partitioning.