In this exercise, we’ll enhance our understanding of using the debugger in nRF Connect for VS Code. Building upon the basics covered in Lesson 1-Exercise 1, we’ll experiment with direct interaction with SoC/SiP peripherals through direct reading or writing operations using the debugger. Then, we’ll explore advanced debugging methods, including conditional breakpoints, non-halting debugging with Cortex-M Debug Monitor, which is useful for scenarios like debugging a Bluetooth LE application and debugging nRF Connect SDK /Zephyr libraries using non-invasive methods.
This exercise consists of two parts. First, we will use the peripheral view available when using the debug feature in VS Code to control the LED of the development kit. In the second part, we will take a look at advanced debugging techniques.
Exercise steps
Part 1 – Peripheral interaction
Open the code base of the exercise by navigating to Create a new application in the nRF Connect for VS Code extension, select Copy a sample, and search for Lesson 2 – Exercise 1. Make sure you are on the branch that matches the SDK version you are using.
Create a new build configuration for your device. Select Optimize for debugging in the Optimization menu and build configuration
2. Enter debug mode in VS Code.
Inside the nRF Connect extension, select the debug action
Important
Starting from nRF Connect SDK v2.8.0, Sysbuild is the default build system. You must select a specific application image (not the full build system) before the Debug option is available. This is done by selecting the correct image from the APPLICATIONS view.
3. Overview of the peripherals.
The application is halted at the start of the main loop. Now we shall toggle LED 1 by manipulating the GPIO register values.
In this exercise, an nRF52840 is used, however, the steps will be the same on other devices, only the pin number will differ. By looking at the bottom side of the DK, you can see which pin is connected to LED1. On the nRF52840dk LED1 is connected to P0.13.
3.1 Figure out which GPIO pin is connected to LED1 on your board.
Look at the bottom of your DK to see which pin is connected to LED1. We will edit this pin in the following steps.
On the nRF52840 DK, LED1 is connected to P0.13.
3.2 Exploring the GPIO
Find the GPIO P0 or P1 menu in the peripherals view, depending on if you want to change P0.xx or P1.xx. In this we want to change P0.13 so we expand the GPIO P0 menu.
3.2. Configure the pins
Expand the “DIR” submenu so that you can find the pin you want to change. In this case, we will change PIN 13
Configure the pin (PIN 13 in this case) as output by changing it from Input to Output.
3.3. Toggle the LED
Expand the “OUT” submenu to find the same pin again (PIN 13 in this case).
Change the pin from low to high and back to toggle LED1.
Part 2 – Advanceddebugging techniques
4. Add some basic logic to the application.
Add the following code to main.c
Copy
for (int i = 0; i < 10; i++){ test_var = test_var + 1;LOG_INF("test_var = %d",test_var);}
C
5. Build and flash the application.
Connect to the serial interface for the device, build the application, and flash the device.
When the application runs, you should see the following output.
Something is strange here, 127+1 should not equal -128. So let’s use the debugging feature in VS Code to understand what is happening.
6.1. Add a conditional breakpoint
We have seen how to add a regular breakpoint in Lesson 1 – Exercise 1, however, there are situations where a regular breakpoint is not the best alternative. For example, the integer overflow problem that we experienced when running the code is encountered inside a loop, and it is manifested right after the condition (test_var == 127), after that, things go sideways. Using a regular breakpoint inside a loop means that we will need to halt the code on every iteration, and we need to manually press Continue until we reach the condition that triggers the issue. This, in some situations, could be either an impractical or inefficient process. For such cases will use a conditional breakpoint.
We will add an Advanced conditional breakpoint of type Expression condition, which is triggered only when an expression evaluates to true. In our simple example, that would be (test_var == 127).
6.1.1 Right-click in the column (next to the line number) on the line where test_var is incremented and select Add Conditional Breakpoint
6.1.2 in the Expression field, type in the condition we want to halt execution on (test_var == 127). Make sure to press enter.
6.2 Add a regular breakpoint on main() so we can compare the two types.
Notice that a conditional breakpoint has a different icon than the regular breakpoint icon.
6.3 Run the application in debug mode
The application will halt at main() since we added a regular breakpoint there.
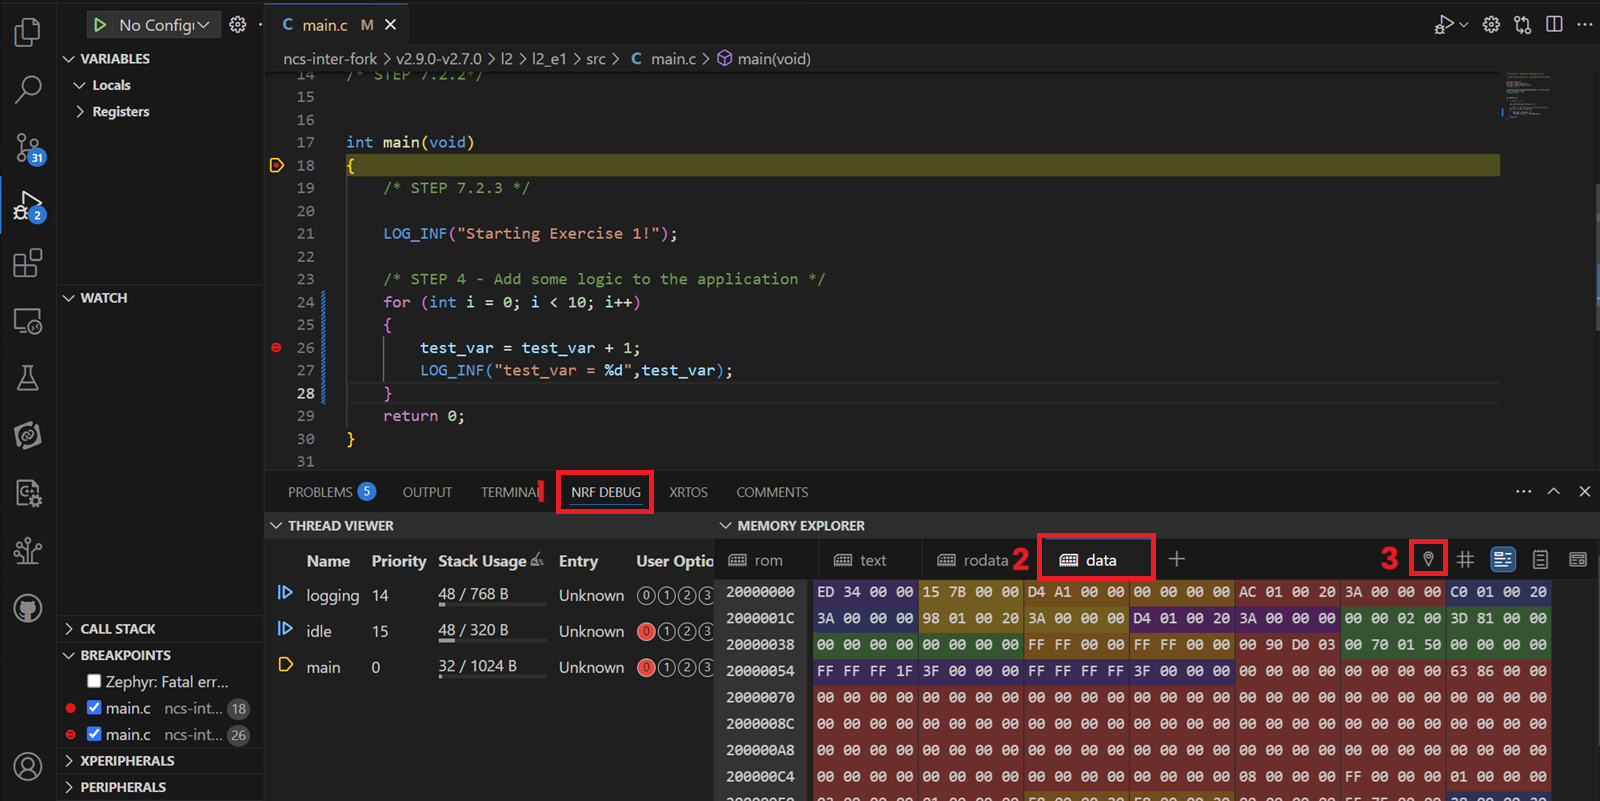
6.4 Open nRF Debug -> Memory Explorer -> Data
Then click the Go to Symbol icon in the upper right-hand corner in the data window, see the image below.
More on this
To get the same colorful view as the image above, select the Show symbols icon in the menu, see image below.
6.5 Type in the global variable you would like to examine in memory; in our case, that would be test_var.
The memory region allocated to that variable will be highlighted as shown below:
Note
The “Go to Symbol” works only for global objects (global variable, global functions, etc.). For local objects, you need to find out the address of the local object and use the “Go to address” functionality, which is the # symbol.
The memory explorer will show you the memory region around where the object of interest is located (e.g., the variable test_var). This is quite useful for detecting out-of-bound memory writing. The memory explorer also allows you to read/write directly to memory, the same as we did for peripherals.
6.6 Hit the Continue button (F5) to run the application to the next breakpoint, which is a conditional breakpoint triggered right before the integer overflow.
Notice how the memory location allocated to the variable test_var holds the value 127(0x7F) and how we can see neighboring memory addresses of the variable. We can actually hover the mouse over the neighboring cells and find out which objects are located in that region. This is quite useful when debugging stacks and large buffer overflows.
You can also right-click on the variable name and select Add to Watch, the same as we did in Lesson 1 Exercise 1.
6.7 Press Step Over (F10) to execute the next line
The test_var is defined as an int8_t variable, which is a signed integer type with a width of exactly 8 bits. What’s happening is that a signed 8-bit int has a minimum value of -128 and a maximum value of 127. So when test_var had the value of 127 and we tried to increment it again, we tried to add a too-large value for an 8-bit int, which caused an integer overflow.
For the compiler used, the behavior was to flip the variable around to the minimum value. Please be aware that integer overflow has an outcome of undefined behavior by the C standard, so such situations should be prevented in the code by applying the right programming techniques (For example: Check against INT8_MAX and INT8_MIN before incrementing/decrementing).
Overflow and underflow errors can lead to unexpected results in the application, so it’s important to be aware of them and take steps to prevent them. The same may happen in a stack; this is called a stack overflow. A stack overflow happens if the stack uses more memory than what is allocated to it.
v2.9.0 – v2.7.0
In this exercise, we’ll enhance our understanding of using the debugger in nRF Connect for VS Code. Building upon the basics covered in Lesson 1-Exercise 1, we’ll experiment with direct interaction with SoC/SiP peripherals through direct reading or writing operations using the debugger. Then, we’ll explore advanced debugging methods, including conditional breakpoints, non-halting debugging with Cortex-M Debug Monitor, which is useful for scenarios like debugging a Bluetooth LE application and debugging nRF Connect SDK/Zephyr libraries using non-invasive methods.
This exercise consists of two parts. First, we will use the peripheral view available when using the debug feature in VS Code to control the LED of the development kit. In the second part, we will take a look at advanced debugging techniques.
Exercise steps
Part 1 – Peripheral interaction
Open the code base of the exercise by navigating to Create a new application in the nRF Connect for VS Code extension, select Copy a sample, and search for Lesson 2 – Exercise 1. Make sure you are on the branch that matches the SDK version you are using.
Create a new build configuration for your device. Select Optimize for debugging in the Optimization menu and build configuration
2. Enter debug mode in VS Code.
Inside the nRF Connect extension, select the Debug action
Important
Starting from nRF Connect SDK v2.8.0, Sysbuild is the default build system. You must select a specific application image (not the full build system) before the Debug option is available. This is done by selecting the correct image from the APPLICATIONS view.
3. Overview of the peripherals.
The application is halted at the start of the main loop. Now we shall toggle LED 1 by manipulating the GPIO register values.
In this exercise, an nRF52840 is used, however, the steps will be the same on other devices, only the pin number will differ. By looking at the bottom side of the DK, you can see which pin is connected to LED1. On the nRF52840dk LED1 is connected to P0.13.
3.1 Figure out which GPIO pin is connected to LED1 on your board.
By looking at the bottom of your DK, you can see which pin is connected to LED1. This is the pin we will edit in the following steps.
On the nRF52840 DK, LED1 is connected to P0.13.
3.2 Exploring the GPIO
Find the GPIO P0 or P1 menu in the peripherals view, depending on if you want to change P0.xx or P1.xx. In this we want to change P0.13 so we expand the GPIO P0 menu.
3.2. Configure the pins
Expand the “DIR” submenu so that you can find the pin you want to change. In this case, we will change PIN 13
Configure the pin (PIN 13 in this case) as output by changing it from Input to Output.
3.3. Toggle the LED
Expand the “OUT” submenu to find the same pin again (PIN 13 in this case).
Change the pin from low to high and back to toggle LED1.
Part 2 – Advanceddebugging techniques
4. Add some basic logic to the application.
Add the following code to main.c
Copy
for (int i = 0; i < 10; i++){ test_var = test_var + 1;LOG_INF("test_var = %d",test_var);}
C
5. Build and flash the application.
Connect to the serial interface for the device, build the application, and flash the device.
When the application runs, you should see the following output.
Something is strange here, 127+1 should not equal -128. So let’s use the debugging feature in VS Code to understand what is happening.
6.1. Add a conditional breakpoint
We have seen how to add a regular breakpoint in Lesson 1 – Exercise 1, however, there are situations where a regular breakpoint is not the best alternative. For example, the integer overflow problem that we experienced when running the code is encountered inside a loop, and it is manifested right after the condition (test_var == 127), after that, things go sideways. Using a regular breakpoint inside a loop means that we will need to halt the code on every iteration, and we need to manually press Continue until we reach the condition that triggers the issue. This, in some situations, could be either an impractical or inefficient process. For such cases will use a conditional breakpoint.
We will add an Advanced conditional breakpoint of type Expression condition, which is triggered only when an expression evaluates to true. In our simple example, that would be (test_var == 127).
6.1.1 Right-click in the column (next to the line number) on the line where test_var is incremented and select Add Conditional Breakpoint
6.1.2 in the Expression field, type in the condition we want to halt execution on (test_var == 127). Make sure to press enter.
6.2 Add a regular breakpoint on main() so we can compare the two types.
Notice that a conditional breakpoint has a different icon than the regular breakpoint icon.
6.3 Run the application in debug mode
The application will halt at main() since we added a regular breakpoint there.
6.4 Open nRF Debug -> Memory Explorer -> Data
Then click the Go to Symbol icon in the upper right hand corner in the data window, see the image below.
More on this
To get the same colorful view as the image above, select the Show symbols icon in the menu, see image below.
6.5 Type in the global variable you would like to examine in memory; in our case, that would be test_var.
The memory region allocated to that variable will be highlighted as shown below:
Note
The “Go to Symbol” works only for global objects (global variable, global functions, etc.). For local objects, you need to find out the address of the local object and use the “Go to address” functionality, which is the # symbol.
The memory explorer will show you the memory region around where the object of interest is located (e.g. the variable test_var). This is quite useful to detect if there is any out-of-bound memory writing. The memory explorer also allows you to read/write directly to memory, same as we did for peripherals.
6.6 Hit the Continue button (F5) to run the application to the next breakpoint, which is a conditional breakpoint that is triggered right before the integer overflow happens.
Notice how the memory location allocated to the variable test_var holds the value 127(0x7F) and how we can see neighboring memory addresses of the variable. We can actually hover the mouse over the neighboring cells and find out which objects are located in that region. This is quite useful when debugging stack and large buffers overflow.
You can also right-click on the variable name and select Add to Watch, the same as we did in Lesson 1 Exercise 1.
6.7 Press Step Over (F10) to execute the next line
The test_var is defined as an int8_t variable, which is a signed integer type with a width of exactly 8 bits. What’s happening is that a signed 8-bit int has a minimum value of -128 and a maximum value of 127. So when test_var had the value of 127 and we tried to increment it again, we tried to add a too-large value for an 8-bit int, which caused an integer overflow.
For the compiler used, the behavior was to flip the variable around to the minimum value. Please be aware that integer overflow has an outcome of undefined behavior by the C standard, so such situations should be prevented in the code by applying the right programming techniques (For example: Check against INT8_MAX and INT8_MIN before incrementing/decrementing).
Overflow and underflow errors can lead to unexpected results in the application, so it’s important to be aware of them and take steps to prevent them. The same may happen in a stack; this is called a stack overflow. A stack overflow happens if the stack uses more memory than what is allocated to it.
v2.6.2 – v2.5.2
In this exercise, we’ll enhance our understanding of using the debugger in nRF Connect for VS Code. Building upon the basics covered in Lesson 1-Exercise 1, we’ll experiment with direct interaction with SoC/SiP peripherals through direct reading or writing operations using the debugger. Then, we’ll explore advanced debugging methods, including conditional breakpoints, non-halting debugging with Cortex-M Debug Monitor, which is useful for scenarios like debugging a Bluetooth LE application and debugging nRF Connect SDK /Zephyr libraries using non-invasive methods.
This exercise consists of two parts. First, we will use the peripheral view available when using the debug feature in VS Code to control the LED of the development kit. In the second part, we will take a look at advanced debugging techniques.
Exercise steps
Part 1 – Peripheral interaction
Open the code base of the exercise by navigating to Create a new application in the nRF Connect for VS Code extension, select Copy a sample, and search for Lesson 2 – Exercise 1. Make sure you are on the branch that matches the SDK version you are using.
Create a new build configuration for your device. Select Optimize for debugging in the Optimization menu and build configuration
2. Enter debug mode in VS Code.
Inside the nRF Connect extension, select the debug action
3. Overview of the peripherals.
The application is halted at the start of the main loop. Now we shall toggle LED 1 by manipulating the GPIO register values. In this exercise, an nRF52840 is used, however, the steps will be the same on other devices, only the pin number will differ. By looking at the bottom side of the DK, you can see which pin is connected to LED1. On the nRF52840dk LED1 is connected to P0.13.
3.1. Exploring the GPIO
Find the GPIO P0 menu in the peripherals view
3.2. Configure the pins
Expand the “DIR” submenu so that you can find PIN 13
Configure PIN 13 as output by changing it from Input to Output
3.3. Toggle the LED
Expand the “OUT” submenu so that you can find PIN 13
The LED1 should now be turned on. To toggle it off, set PIN 13 to High
Part 2 – Advanceddebugging techniques
4. Add some basic logic to the application.
Add the following code to main.c
Copy
for (int i = 0; i < 10; i++){ test_var = test_var + 1;LOG_INF("test_var = %d",test_var);}
C
5. Build and flash the application.
Connect to the serial interface for the device, build the application, and flash the device.
When the application runs, you should see the following output.
Something is strange here, 127+1 should not equal -128. So let’s use the debugging feature in VS Code to understand what is happening.
6.1. Adding a conditional breakpoint
We have seen how to add a regular breakpoint in Lesson 1 – Exercise 1, however, there are situations where a regular breakpoint is not the best alternative. For example, the integer overflow problem that we experienced when running the code is encountered inside a loop, and it is manifested right after the condition (test_var == 127), after that, things go sideways. Using a regular breakpoint inside a loop means that we will need to halt the code on every iteration, and we need to manually press Continue until we reach the condition that triggers the issue. This, in some situations, could be either an impractical or inefficient process. For such cases will use a conditional breakpoint.
We will add an Advanced conditional breakpoint of type Expression condition, which is triggered only when an expression evaluates to true. In our simple example, that would be (test_var == 127).
6.1.1 Right-click in the column (next to the line number) on the line where test_var is incremented and select Add Conditional Breakpoint
6.1.2 in the Expression field, type in the condition we want to halt execution on (test_var == 127). Make sure to press enter.
6.2 Add a regular breakpoint on main() so we can compare the two types.
Notice that a conditional breakpoint has a different icon than the regular breakpoint icon.
6.3 Run the application in debug mode
6.4 The application will halt at main() since we added a regular breakpoint there. Open nRF Debug -> Memory Explorer -> Ram -> Go to Symbol.
6.5 Type in the global variable you would like to examine in memory; in our case, that would be test_var.
The memory region allocated to that variable will be highlighted as shown below:
Note
The “Go to Symbol” works only for global objects (global variable, global functions, etc.). For local objects, you need to find out the address of the local object and use the “Go to address” functionality. It’s the # symbol.
The memory explorer will show you the memory region around where the object of interest is located (Eg. the variable test_var). This is quite useful to detect if there is any out-of-bound memory writing. The memory explorer also allows you to read/write directly to memory same as we did for peripherals.
6.6 Hit the Continue button or F5 to run the application to the next breakpoint, which is a conditional breakpoint that is triggered right before the integer overflow happens.
Notice how the memory location allocated to the variable test_var holds the value 127(0x7F) and how we can see neighboring memory addresses of the variable. We can actually hover the mouse over the neighboring cells and find out which objects are located in that region. This is quite useful when debugging stack and large buffers overflow.
You can also right-click on the variable name and select Add to Watch, the same as we did in Lesson 1 Exercise 1.
6.7 Press Step Over (F10) to execution the next line
The test_var is defined as an int8_t variable, which is a signed integer type with a width of exactly 8 bits. What’s happening is that a signed 8-bit int has a minimum value of -128 and a maximum value of 127. So when test_var had the value of 127 and we tried to increment it again, we tried to add a too-large value for an 8-bit int, which caused an integer overflow. For the compiler used, the behavior was to flip the variable around to the minimum value. Please be aware that integer overflow has an outcome of undefined behavior by the C standard, so such situations should be prevented in the code by applying the right programming techniques (For example: Check against INT8_MAX and INT8_MIN before incrementing/decrementing).
Overflow and underflow errors can lead to unexpected results in the application, so it’s important to be aware of them and take steps to prevent them. The same may happen in a stack; this is called a stack overflow. A stack overflow happens if the stack uses more memory than what is allocated to it.
Nordic Developer Academy Privacy Policy
1. Introduction
In this Privacy Policy you will find information on Nordic Semiconductor ASA (“Nordic Semiconductor”) processes your personal data when you use the Nordic Developer Academy.
References to “we” and “us” in this document refers to Nordic Semiconductor.
2. Our processing of personal data when you use the Nordic Developer Academy
2.1 Nordic Developer Academy
Nordic Semiconductor processes personal data in order to provide you with the features and functionality of the Nordic Developer Academy. Creating a user account is optional, but required if you want to track you progress and view your completed courses and obtained certificates. If you choose to create a user account, we will process the following categories of personal data:
Email
Name
Password (encrypted)
Course progression (e.g. which course you have completely or partly completed)
Certificate information, which consists of name of completed course and the validity of the certificate
Course results
During your use of the Nordic Developer Academy, you may also be asked if you want to provide feedback. If you choose to respond to any such surveys, we will also process the personal data in your responses in that survey.
The legal basis for this processing is GDPR article 6 (1) b. The processing is necessary for Nordic Semiconductor to provide the Nordic Developer Academy under the Terms of Service.
2.2 Analytics
If you consent to analytics, Nordic Semiconductor will use Google Analytics to obtain statistics about how the Nordic Developer Academy is used. This includes collecting information on for example what pages are viewed, the duration of the visit, the way in which the pages are maneuvered, what links are clicked, technical information about your equipment. The information is used to learn how Nordic Developer Academy is used and how the user experience can be further developed.
2.2 Newsletter
You can consent to receive newsletters from Nordic from within the Nordic Developer Academy. How your personal data is processed when you sign up for our newsletters is described in the Nordic Semiconductor Privacy Policy.
3. Retention period
We will store your personal data for as long you use the Nordic Developer Academy. If our systems register that you have not used your account for 36 months, your account will be deleted.
4. Additional information
Additional information on how we process personal data can be found in the Nordic Semiconductor Privacy Policy and Cookie Policy.
Nordic Developer Academy Terms of Service
1. Introduction
These terms and conditions (“Terms of Use”) apply to the use of the Nordic Developer Academy, provided by Nordic Semiconductor ASA, org. nr. 966 011 726, a public limited liability company registered in Norway (“Nordic Semiconductor”).
Nordic Developer Academy allows the user to take technical courses related to Nordic Semiconductor products, software and services, and obtain a certificate certifying completion of these courses. By completing the registration process for the Nordic Developer Academy, you are agreeing to be bound by these Terms of Use.
These Terms of Use are applicable as long as you have a user account giving you access to Nordic Developer Academy.
2. Access to and use of Nordic Developer Academy
Upon acceptance of these Terms of Use you are granted a non-exclusive right of access to, and use of Nordic Developer Academy, as it is provided to you at any time. Nordic Semiconductor provides Nordic Developer Academy to you free of charge, subject to the provisions of these Terms of Use and the Nordic Developer Academy Privacy Policy.
To access select features of Nordic Developer Academy, you need to create a user account. You are solely responsible for the security associated with your user account, including always keeping your login details safe.
You will able to receive an electronic certificate from Nordic Developer Academy upon completion of courses. By issuing you such a certificate, Nordic Semiconductor certifies that you have completed the applicable course, but does not provide any further warrants or endorsements for any particular skills or professional qualifications.
Nordic Semiconductor will continuously develop Nordic Developer Academy with new features and functionality, but reserves the right to remove or alter any existing functions without notice.
3. Acceptable use
You undertake that you will use Nordic Developer Academy in accordance with applicable law and regulations, and in accordance with these Terms of Use. You must not modify, adapt, or hack Nordic Developer Academy or modify another website so as to falsely imply that it is associated with Nordic Developer Academy, Nordic Semiconductor, or any other Nordic Semiconductor product, software or service.
You agree not to reproduce, duplicate, copy, sell, resell or in any other way exploit any portion of Nordic Developer Academy, use of Nordic Developer Academy, or access to Nordic Developer Academy without the express written permission by Nordic Semiconductor. You must not upload, post, host, or transmit unsolicited email, SMS, or \”spam\” messages.
You are responsible for ensuring that the information you post and the content you share does not;
contain false, misleading or otherwise erroneous information
infringe someone else’s copyrights or other intellectual property rights
contain sensitive personal data or
contain information that might be received as offensive or insulting.
Such information may be removed without prior notice.
Nordic Semiconductor reserves the right to at any time determine whether a use of Nordic Developer Academy is in violation of its requirements for acceptable use.
Violation of the at any time applicable requirements for acceptable use may result in termination of your account. We will take reasonable steps to notify you and state the reason for termination in such cases.
4. Routines for planned maintenance
Certain types of maintenance may imply a stop or reduction in availability of Nordic Developer Academy. Nordic Semiconductor does not warrant any level of service availability but will provide its best effort to limit the impact of any planned maintenance on the availability of Nordic Developer Academy.
5. Intellectual property rights
Nordic Semiconductor retains all rights to all elements of Nordic Developer Academy. This includes, but is not limited to, the concept, design, trademarks, know-how, trade secrets, copyrights and all other intellectual property rights.
Nordic Semiconductor receives all rights to all content uploaded or created in Nordic Developer Academy. You do not receive any license or usage rights to Nordic Developer Academy beyond what is explicitly stated in this Agreement.
6. Liability and damages
Nothing within these Terms of Use is intended to limit your statutory data privacy rights as a data subject, as described in the Nordic Developer Academy Privacy Policy. You acknowledge that errors might occur from time to time and waive any right to claim for compensation as a result of errors in Nordic Developer Academy. When an error occurs, you shall notify Nordic Semiconductor of the error and provide a description of the error situation.
You agree to indemnify Nordic Semiconductor for any loss, including indirect loss, arising out of or in connection with your use of Nordic Developer Academy or violations of these Terms of Use. Nordic Semiconductor shall not be held liable for, and does not warrant that (i) Nordic Developer Academy will meet your specific requirements, (ii) Nordic Developer Academy will be uninterrupted, timely, secure, or error-free, (iii) the results that may be obtained from the use of Nordic Developer Academy will be accurate or reliable, (iv) the quality of any products, services, information, or other material purchased or obtained by you through Nordic Developer Academy will meet your expectations, or that (v) any errors in Nordic Developer Academy will be corrected.
You accept that this is a service provided to you without any payment and hence you accept that Nordic Semiconductor will not be held responsible, or liable, for any breaches of these Terms of Use or any loss connected to your use of Nordic Developer Academy. Unless otherwise follows from mandatory law, Nordic Semiconductor will not accept any such responsibility or liability.
7. Change of terms
Nordic Semiconductor may update and change the Terms of Use from time to time. Nordic Semiconductor will seek to notify you about significant changes before such changes come into force and give you a possibility to evaluate the effects of proposed changes. Continued use of Nordic Developer Academy after any such changes shall constitute your acceptance of such changes. You can review the current version of the Terms of Use at any time at https://academy.nordicsemi.com/terms-of-service/
8. Transfer of rights
Nordic Semiconductor is entitled to transfer its rights and obligation pursuant to these Terms of Use to a third party as part of a merger or acquisition process, or as a result of other organizational changes.
9. Third Party Services
To the extent Nordic Developer Academy facilitates access to services provided by a third party, you agree to comply with the terms governing such third party services. Nordic Semiconductor shall not be held liable for any errors, omissions, inaccuracies, etc. related to such third party services.
10. Dispute resolution
The Terms of Use and any other legally binding agreement between yourself and Nordic Semiconductor shall be subject to Norwegian law and Norwegian courts’ exclusive jurisdiction.