In the previous three exercises, we have worked with local debugging where direct debug access to devices is available. In this exercise, we will use Memfault to remotely debug a device, an important feature for debugging deployed in-field devices. We will cover signing up for an account on the Memfault platform, setting up an example project, sending diagnostic data to the Memfault cloud, and using the Memfault web app to explore this data and debug our example application.
Memfault provides an observability and OTA update management platform that is purpose-built for embedded devices. It is optimized for use in constrained microcontroller-based devices and scalable to complex Linux and Android systems; Memfault helps embedded development teams understand exactly how their devices perform in the field and find and fix faults fast.
The Memfault platform not only serves as a powerful tool for monitoring large device fleets at scale, but it also provides tangible benefits from the earliest stages of development. With first-class support integrated into the nRF Connect SDK, embedded development teams can start reaping these benefits from revision 0.0.1!
The exercise is divided into four parts:
Setting up a Memfault account
Enabling Memfault in an nRF Connect SDK sample
Exploring crash data in Memfault
(Optional) Exploring remote debugging
Exercise steps
Part 1 – Setting up a Memfault account
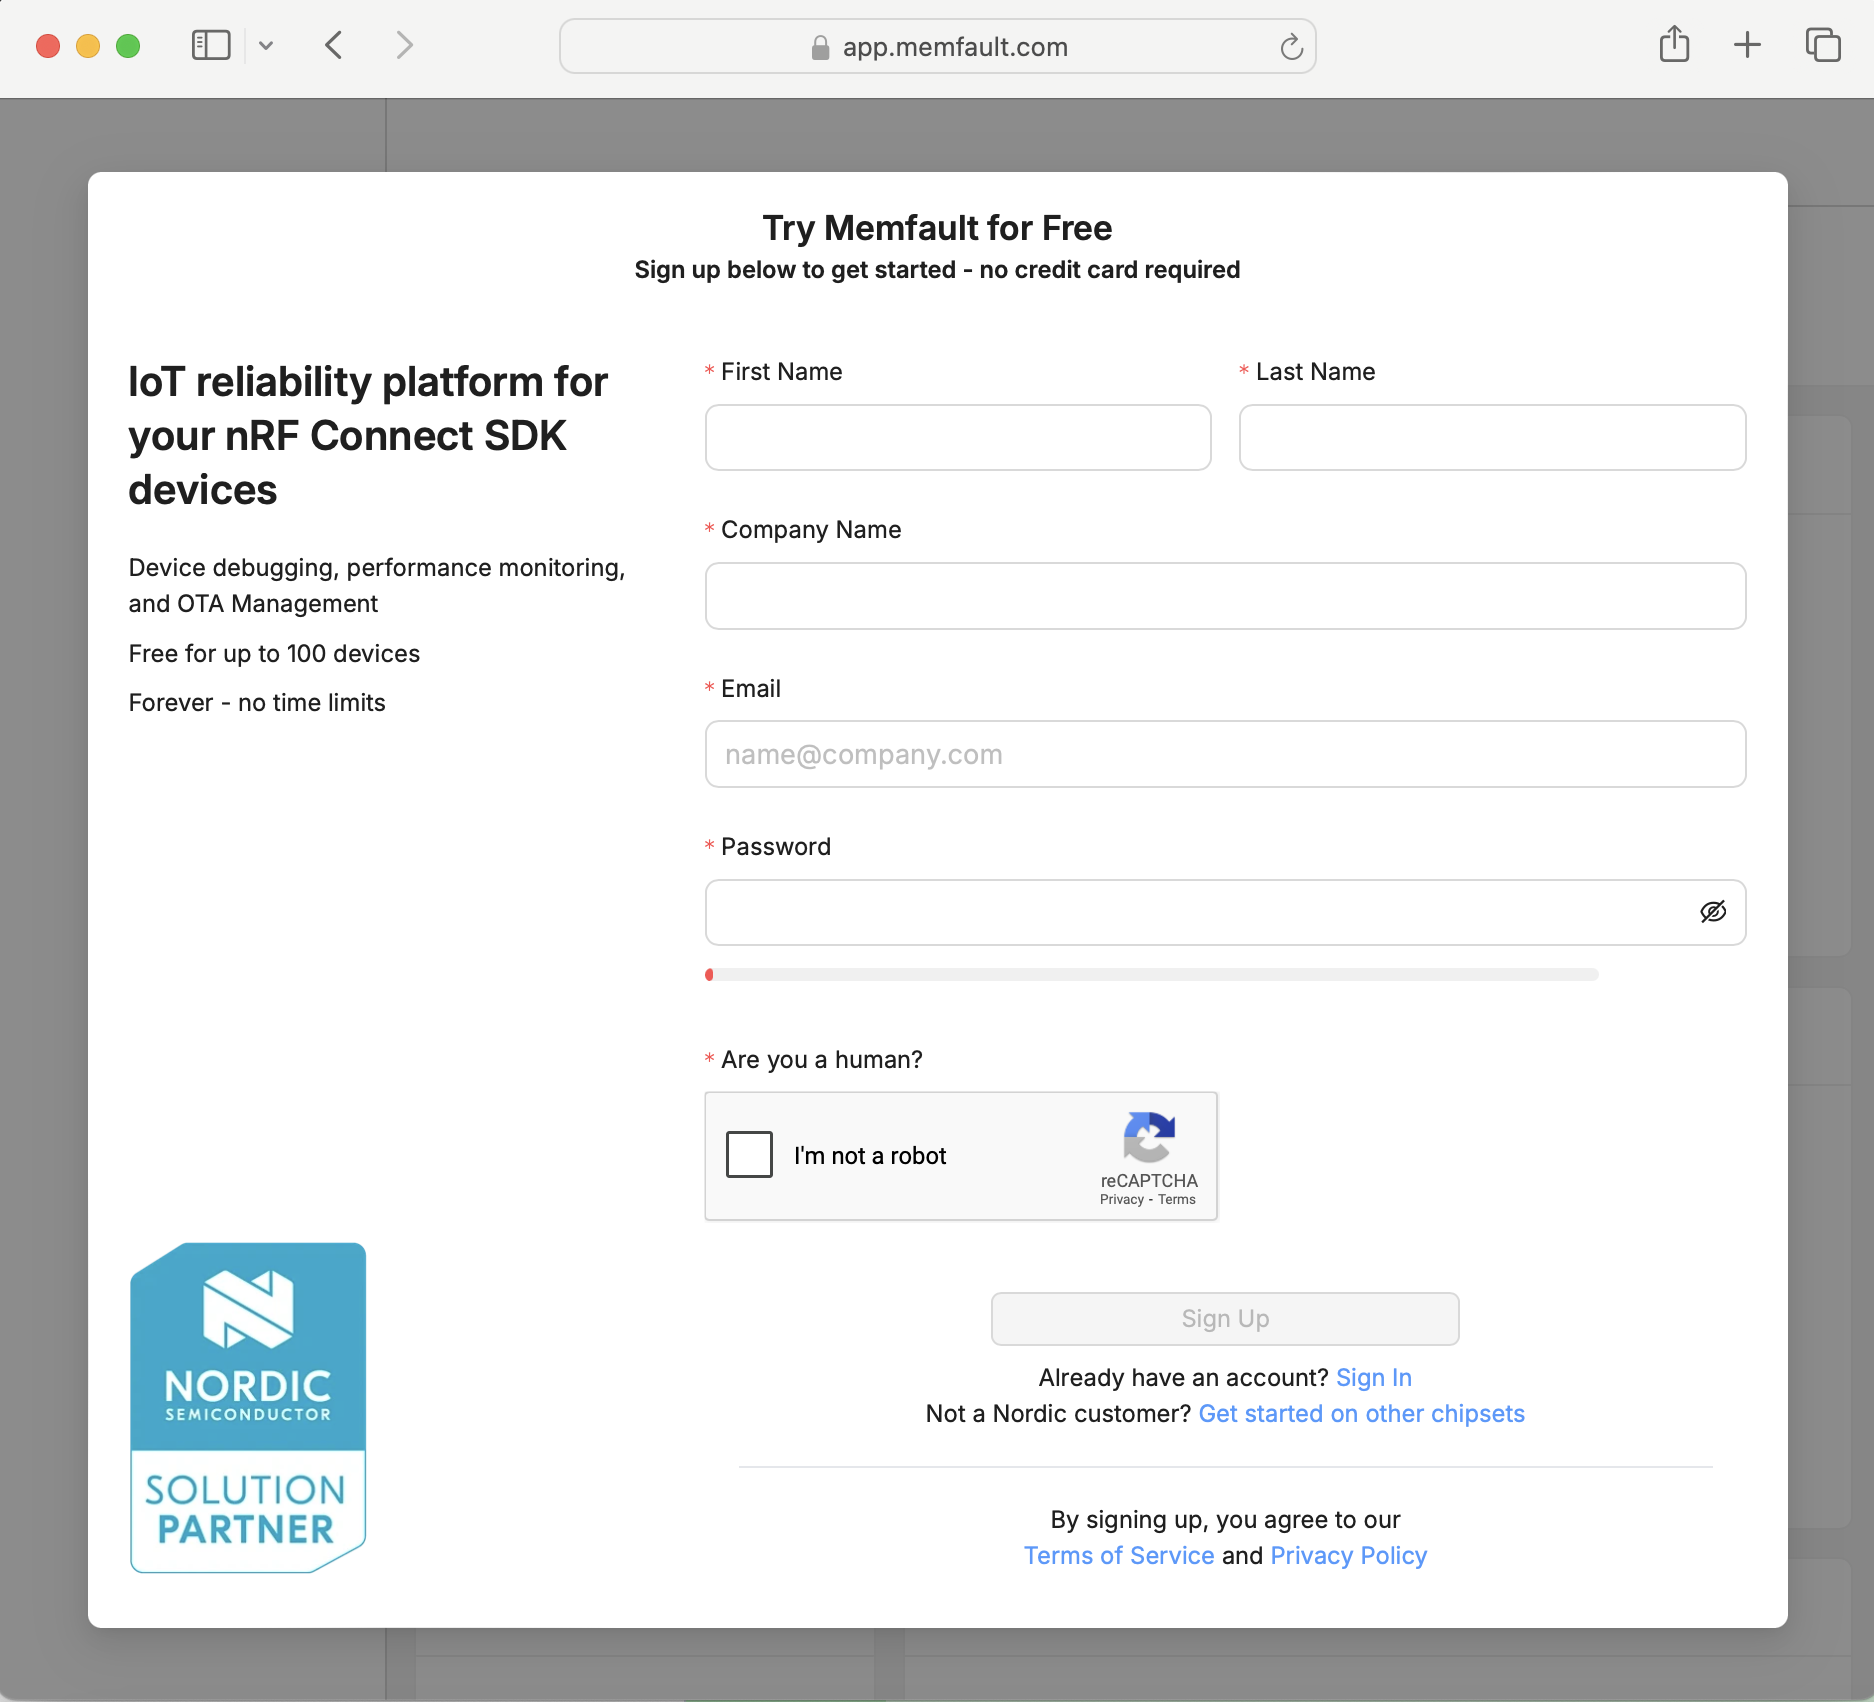
Nordic Developer Academy students are eligible for a free Memfault account for use with all supported Nordic development kits. You can use this account to explore all the platform has to offer as you explore any of the nRF Connect SDK sample applications on your devices.
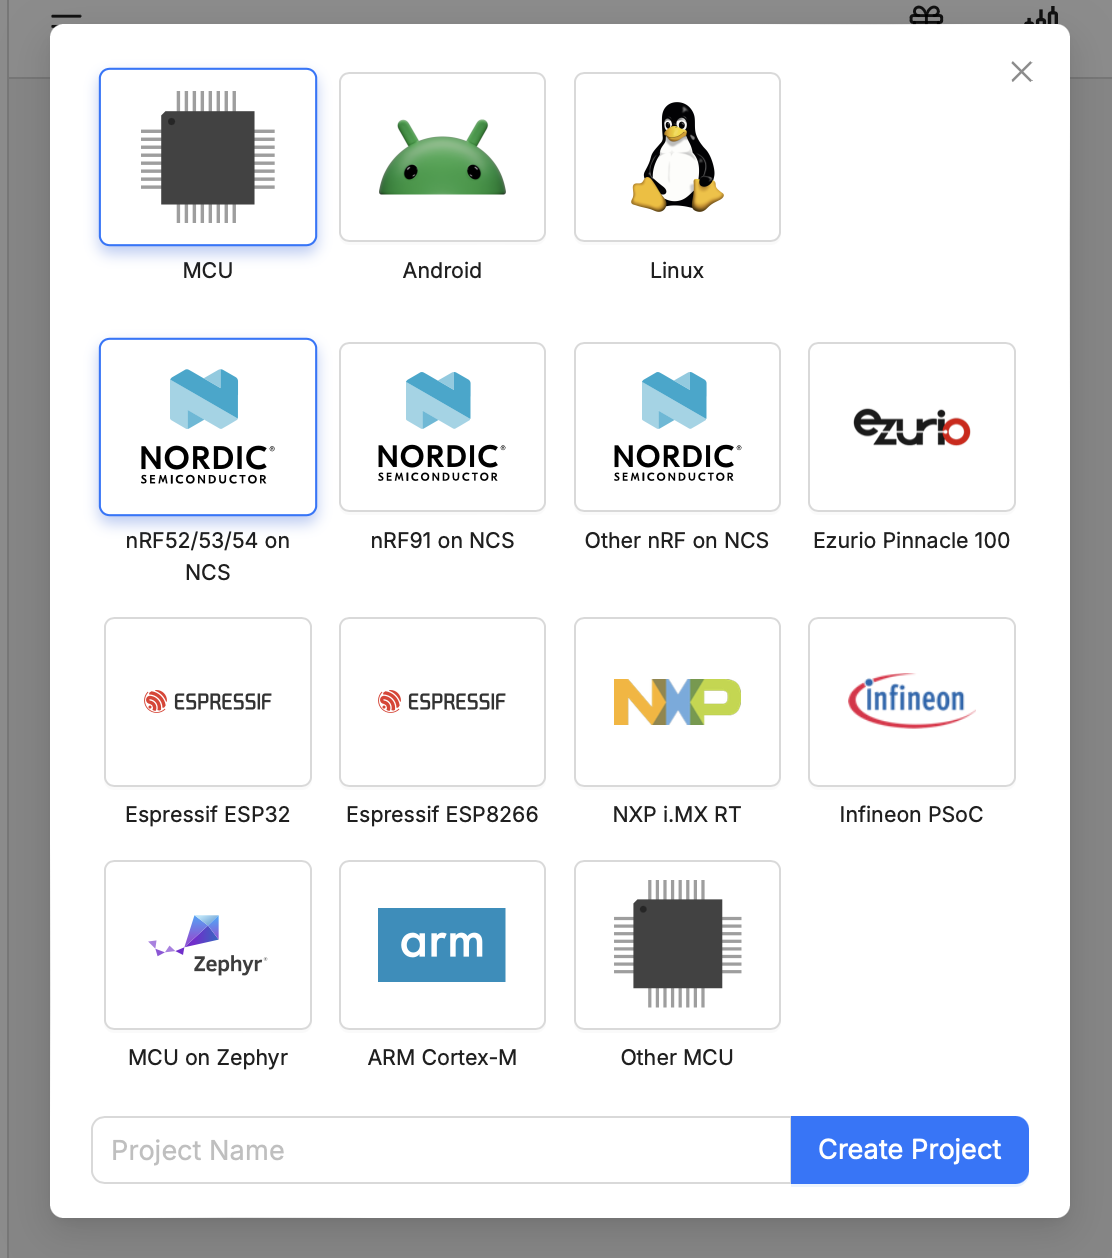
Once you’ve completed the signup process, you will be prompted to create a new Project. Give your project a name. In this example, we will use hello-memfault. Next, select the template corresponding to the development kit you are using. At this point, you’ll be greeted with an empty project just waiting to be populated with rich observability and debugging data.
For the screenshot below, we are using an nRF5340 DK.
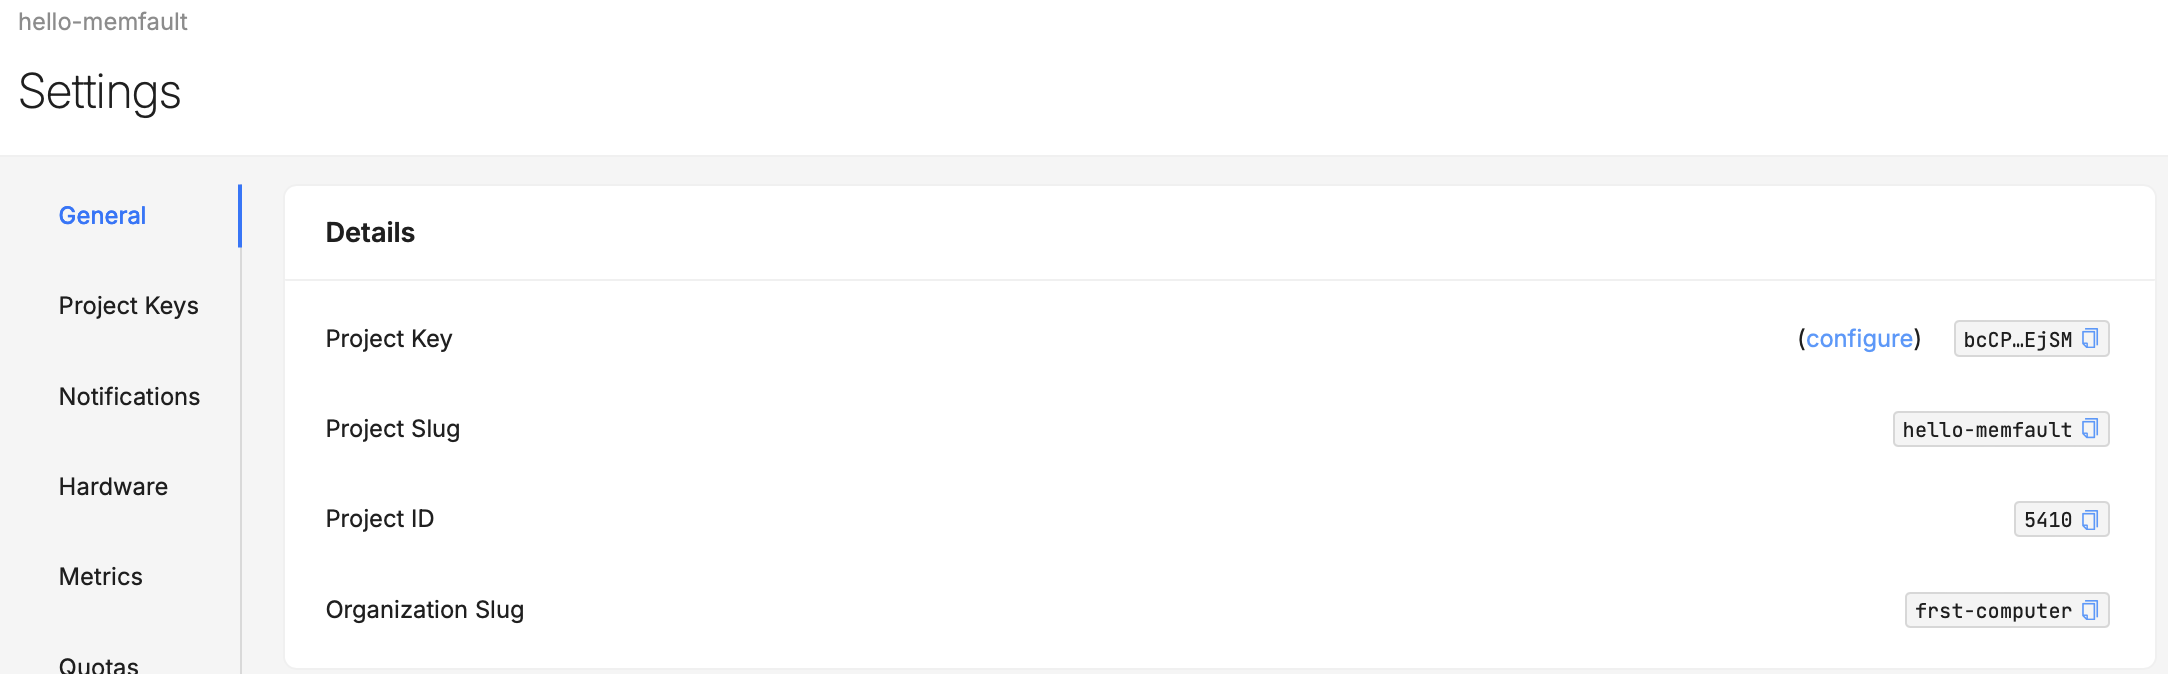
3. Note the Project Key value.
Navigate to the Project Settings view using the left-hand navigation menu and take note of the Project Key value. We’ll use this in a later step to tie our example application to this newly created project.
Great job! You’ve completed Step 1 — now let’s spin up our firmware project to begin populating this project with useful debugging data.
Part 2 – Enabling Memfault in an nRF Connect SDK sample
4. Open up the Hello World application in nRF Connect SDK.
To keep it simple, we’re going to start with the “Hello World” application found under <nRF Connect SDK Install Path>/<version>/zephyr/samples/hello-world.
From the Welcome view in nRF Connect for VS Code, select Create a new application -> Copy a sample -> (SDK Version), then search for and select the “Hello World” app found under zephyr/samples/hello-world. Lastly, select a directory to store the example. Save the application to wherever you cloned the code base for this course, as <ncs_inter_repo>\l2\l2_e4.
5. Build and flash the application to your device.
At this point, you can build and flash the unmodified sample to your board to confirm it works.
Note
For our next steps, we will be using Zephyr’s UART shell capabilities, so you can also go ahead and fire up your favorite serial terminal emulator.
6. Add Memfault to the application.
Since Memfault support is baked into nRF Connect SDK, adding Memfault to the mix is a straightforward affair.
Simply add the following lines to your prj.conf, being sure to include the Project Key collected earlier.
8. Upload the project’s .elf file to the Memfault backend.
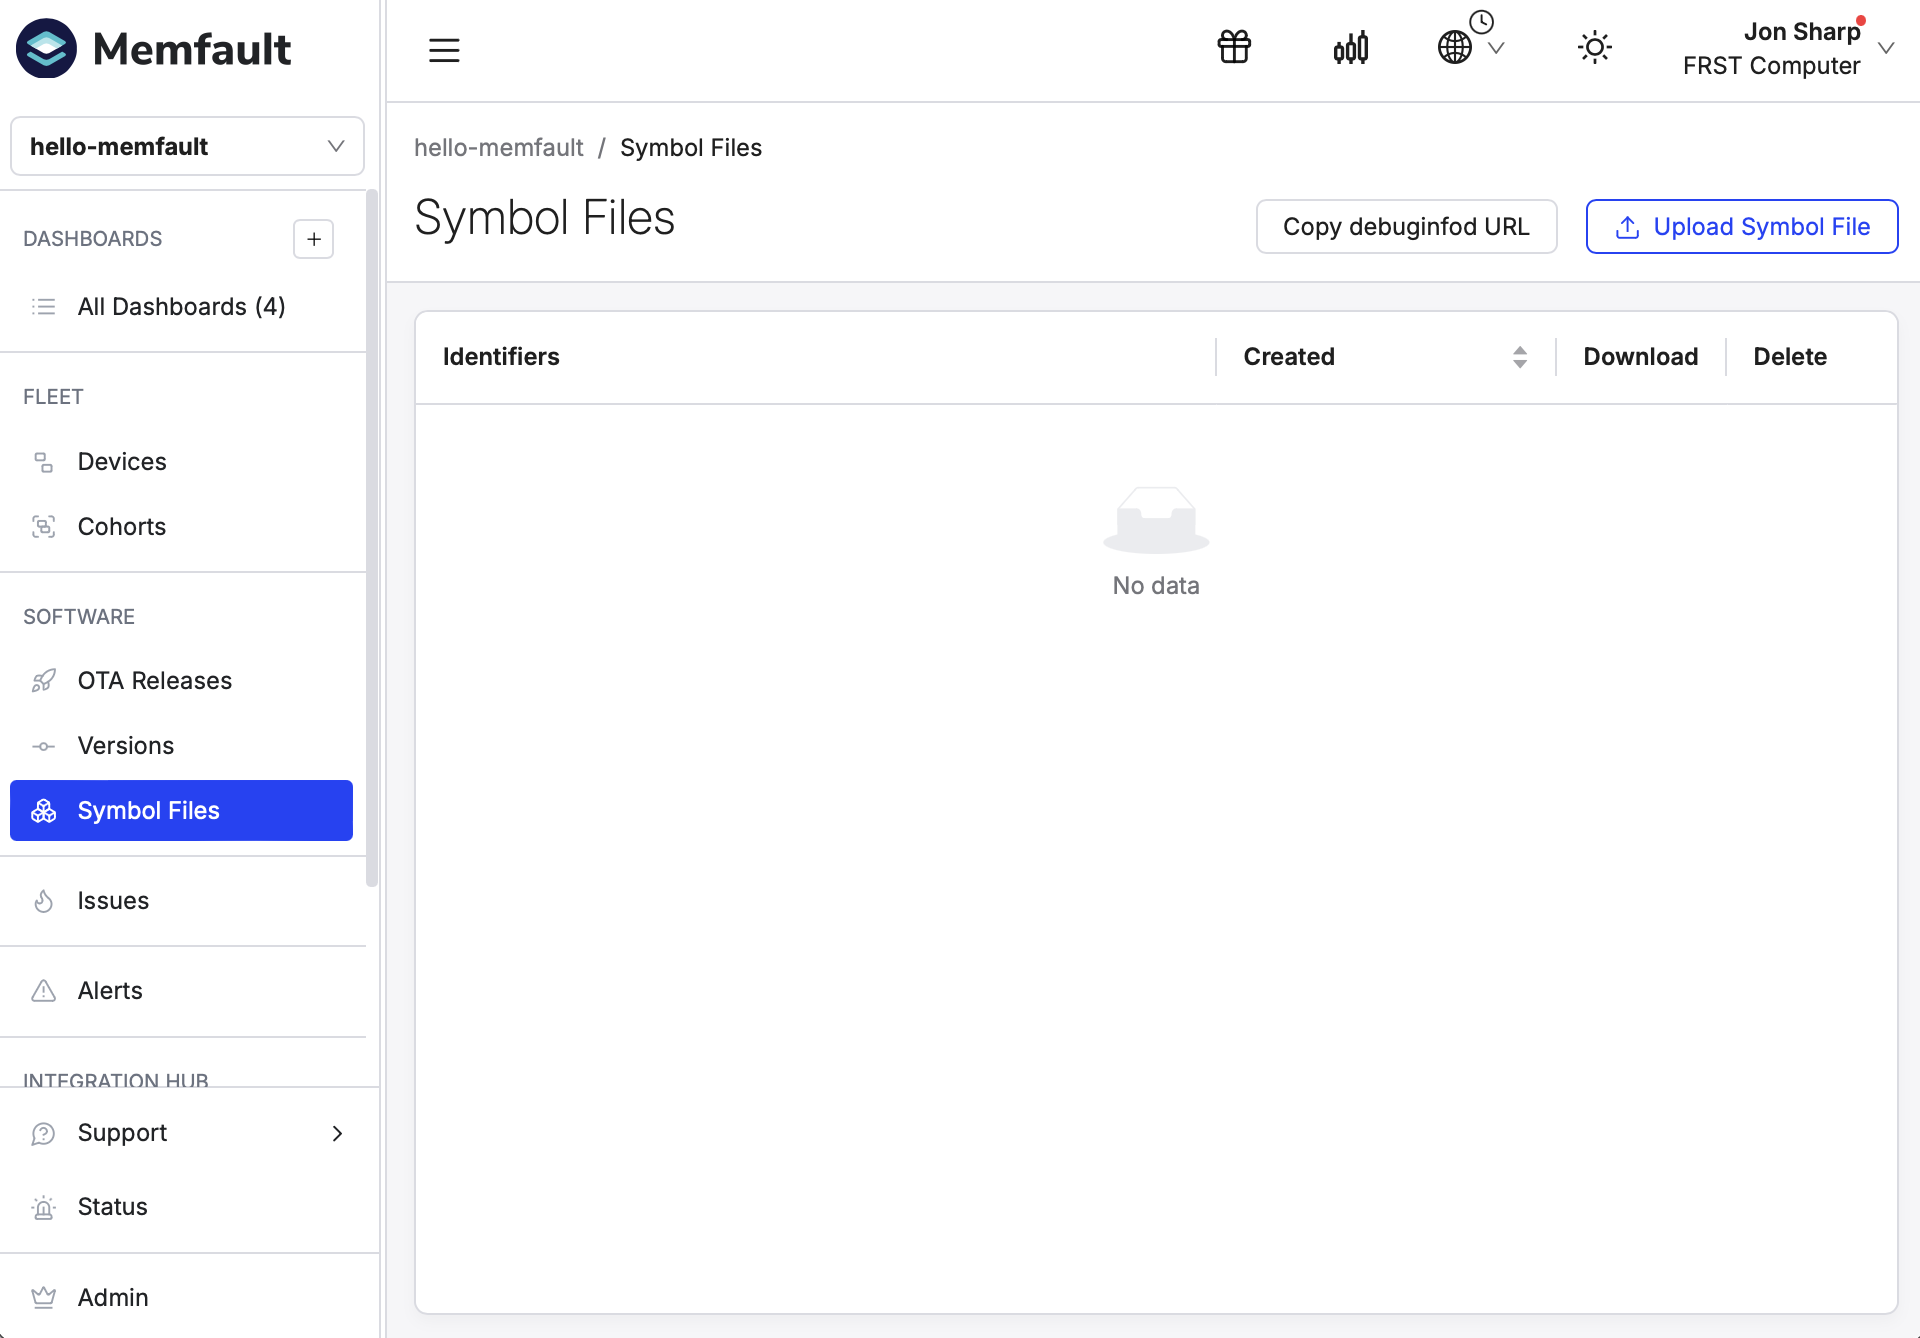
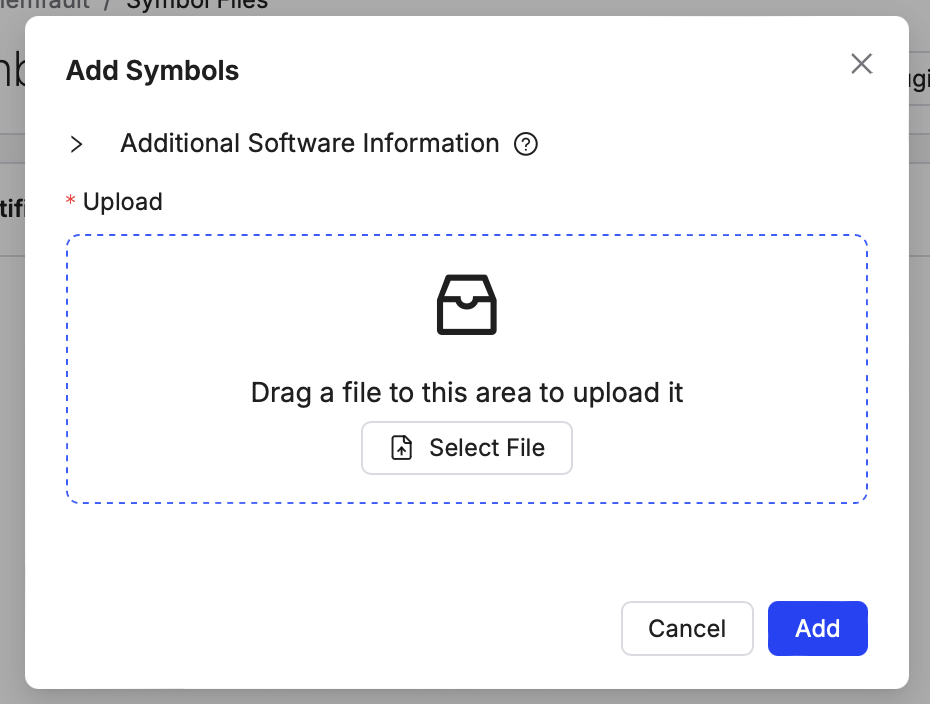
Now that we have a compiled and running firmware, we will equip the Memfault backend with the debug info necessary for the metrics collection and advanced debugging workflows ahead. All that is required is uploading our project’s .elf symbol file, which is securely uploaded and stored in the Memfault backend.
Navigate to the Symbol Files View and select Upload Symbol File in the upper right-hand corner. Then upload your project’s compiled .elf file. This is the zephyr.elf file located in l2/l2_e4/build/l2_e4/zephyr of the course repository.
After uploading, you can return to the serial console of your attached device.
9. Trigger a heartbeat through the shell command.
Memfault’s observability solution begins with tracking key device vitals derived from individual metrics, which are collected automatically at regular “Heartbeat” intervals. By default, these Heartbeat Metrics are collected at hourly intervals. We’ll begin by triggering a Heartbeat and uploading the data to verify metrics are working.
Run the mflt test heartbeat shell command :
Copy
uart:~$mflttestheartbeatTriggeringHeartbeat
Terminal command
10. Export the heartbeat data over UART.
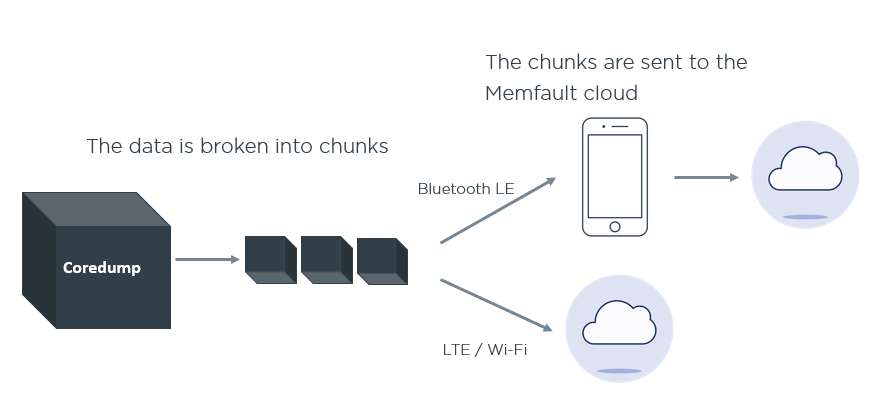
Memfault diagnostic and metric data (and logs!) is stored on-device in an efficient “chunk” data format and is intended to be transmitted to the Memfault cloud using a variety of connectivity paths. While Wi-Fi, cellular network, and Bluetooth LE are the most common, to keep things extra simple for our example, we will be using the Chunks Debug feature of the Memfault web app to simply export our debug data over the UART for import into the platform.
To export our heartbeat metric data, issue the mflt export command in the serial terminal:
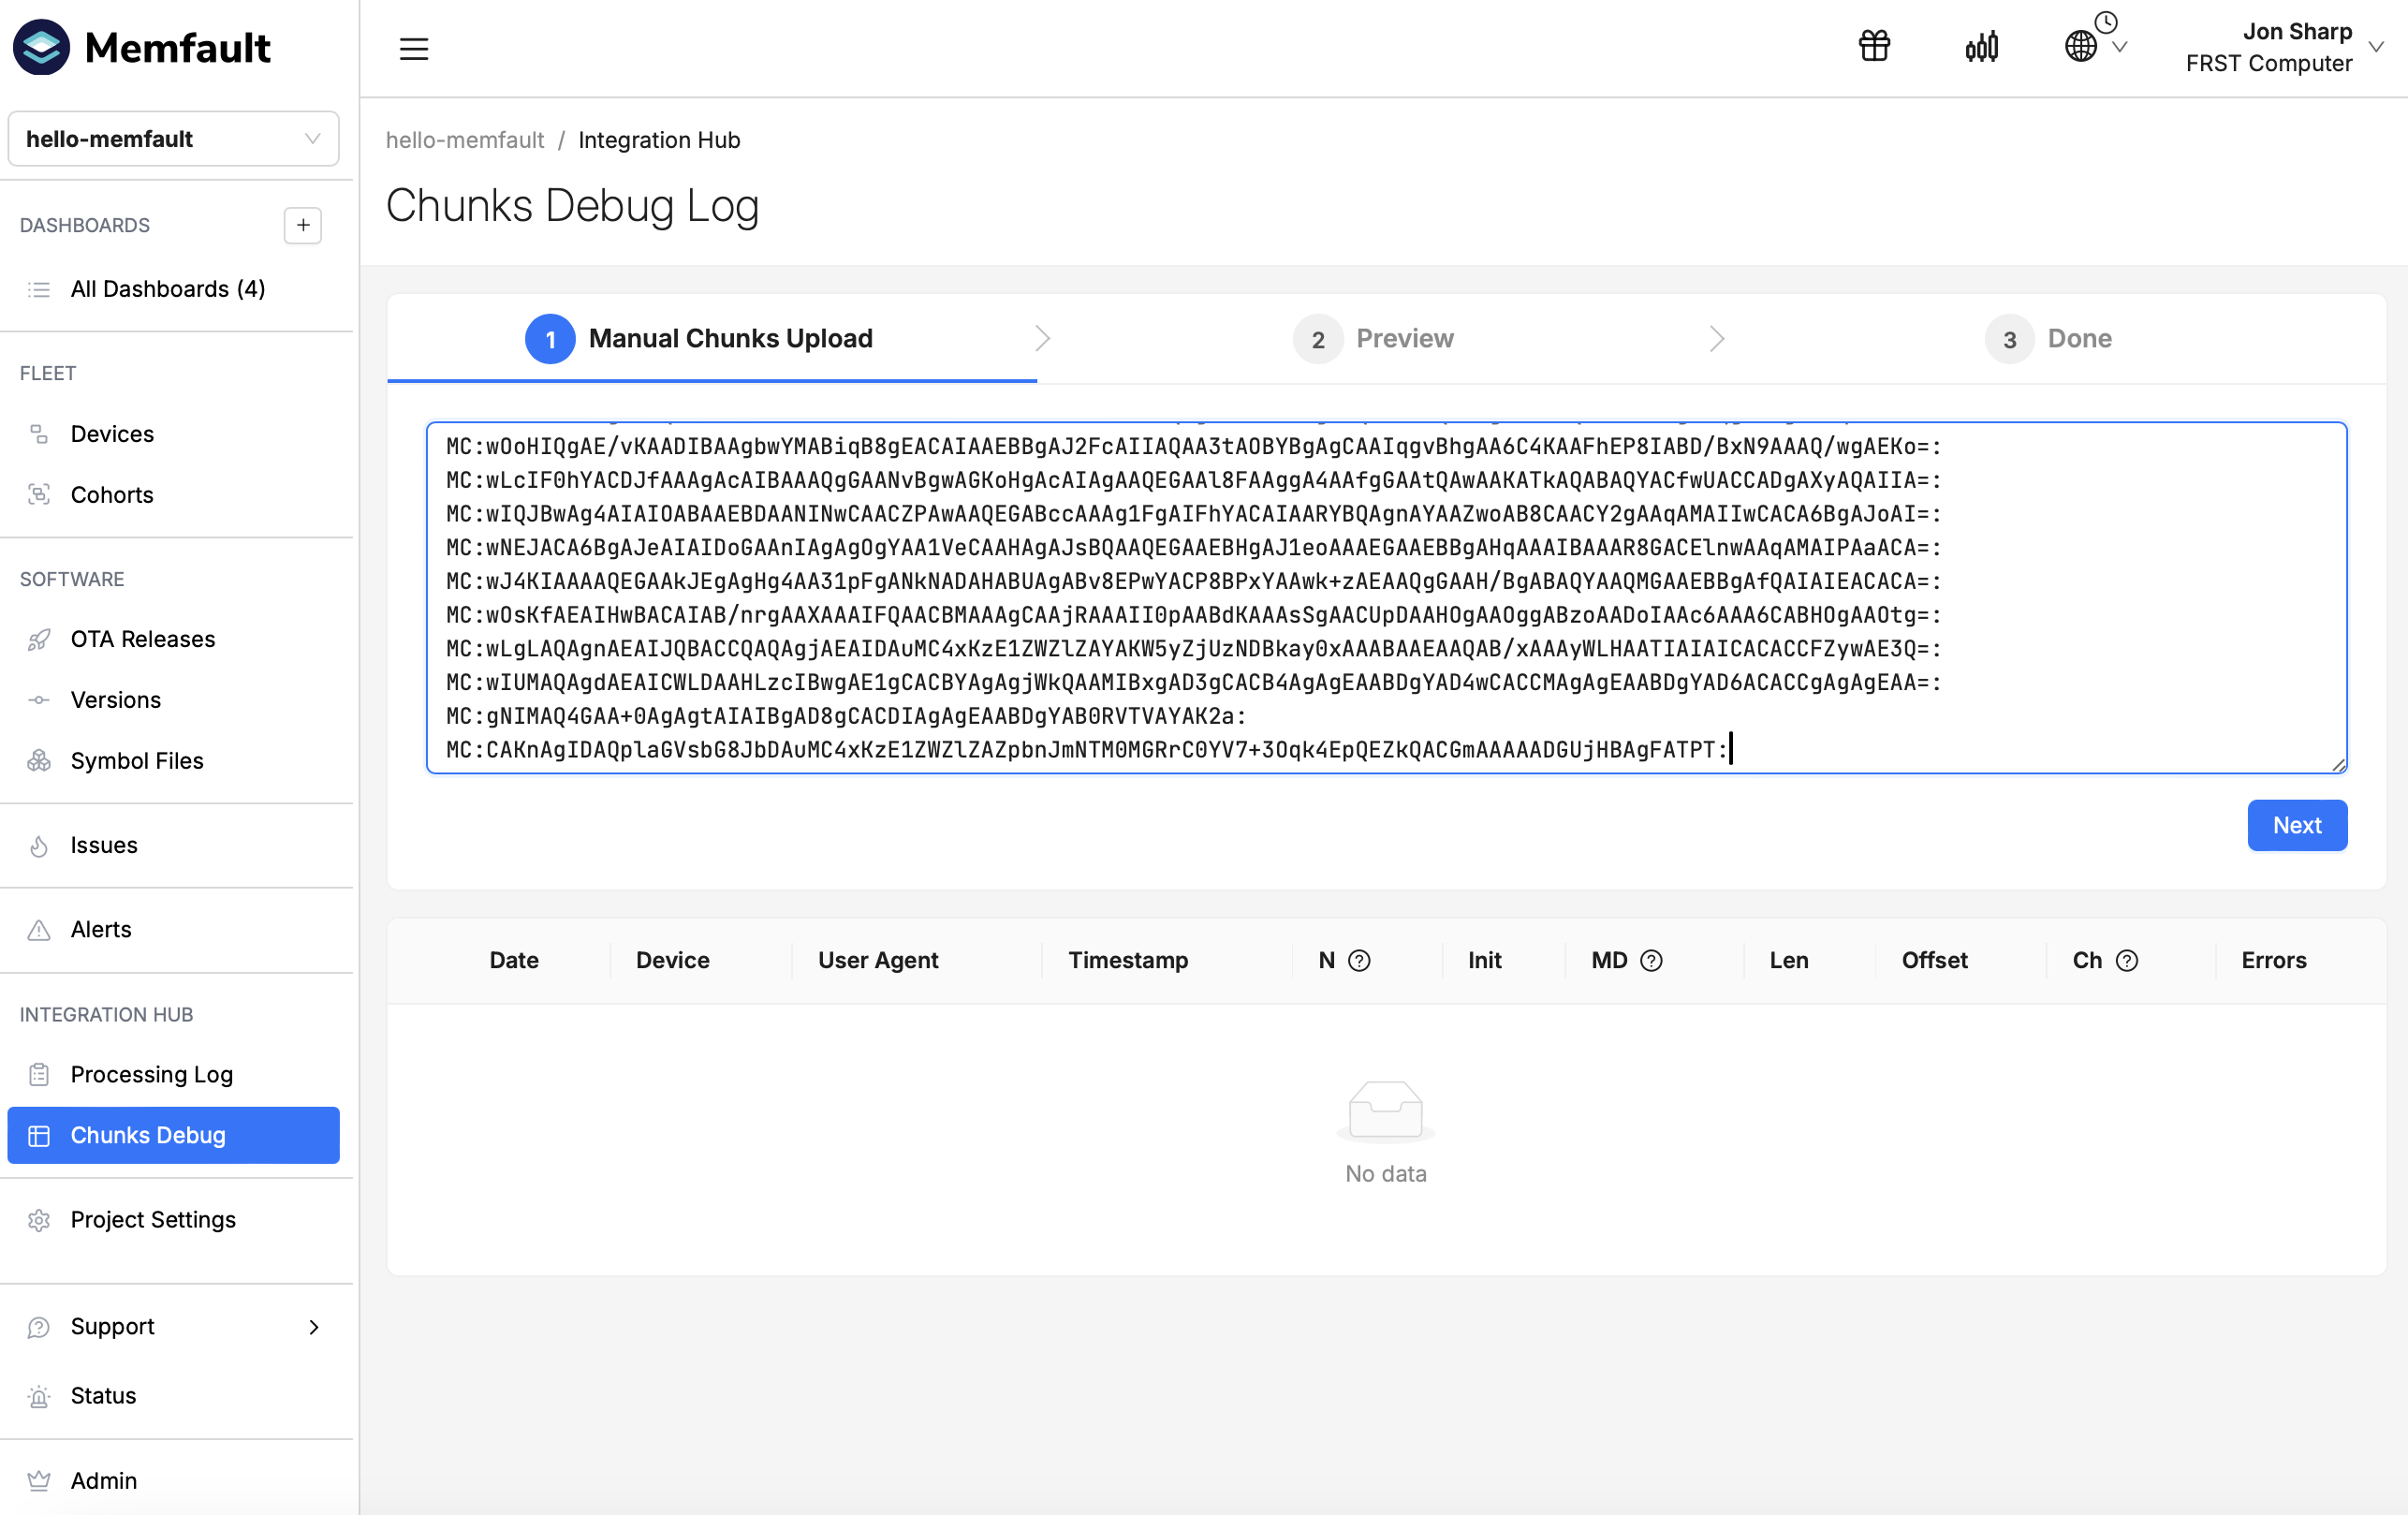
11. Copy and paste the exported data into the Memfault project.
Now, we’ll copy this output (each line beginning with MC:) and paste it into the Chunks Debug view within our Memfault project:
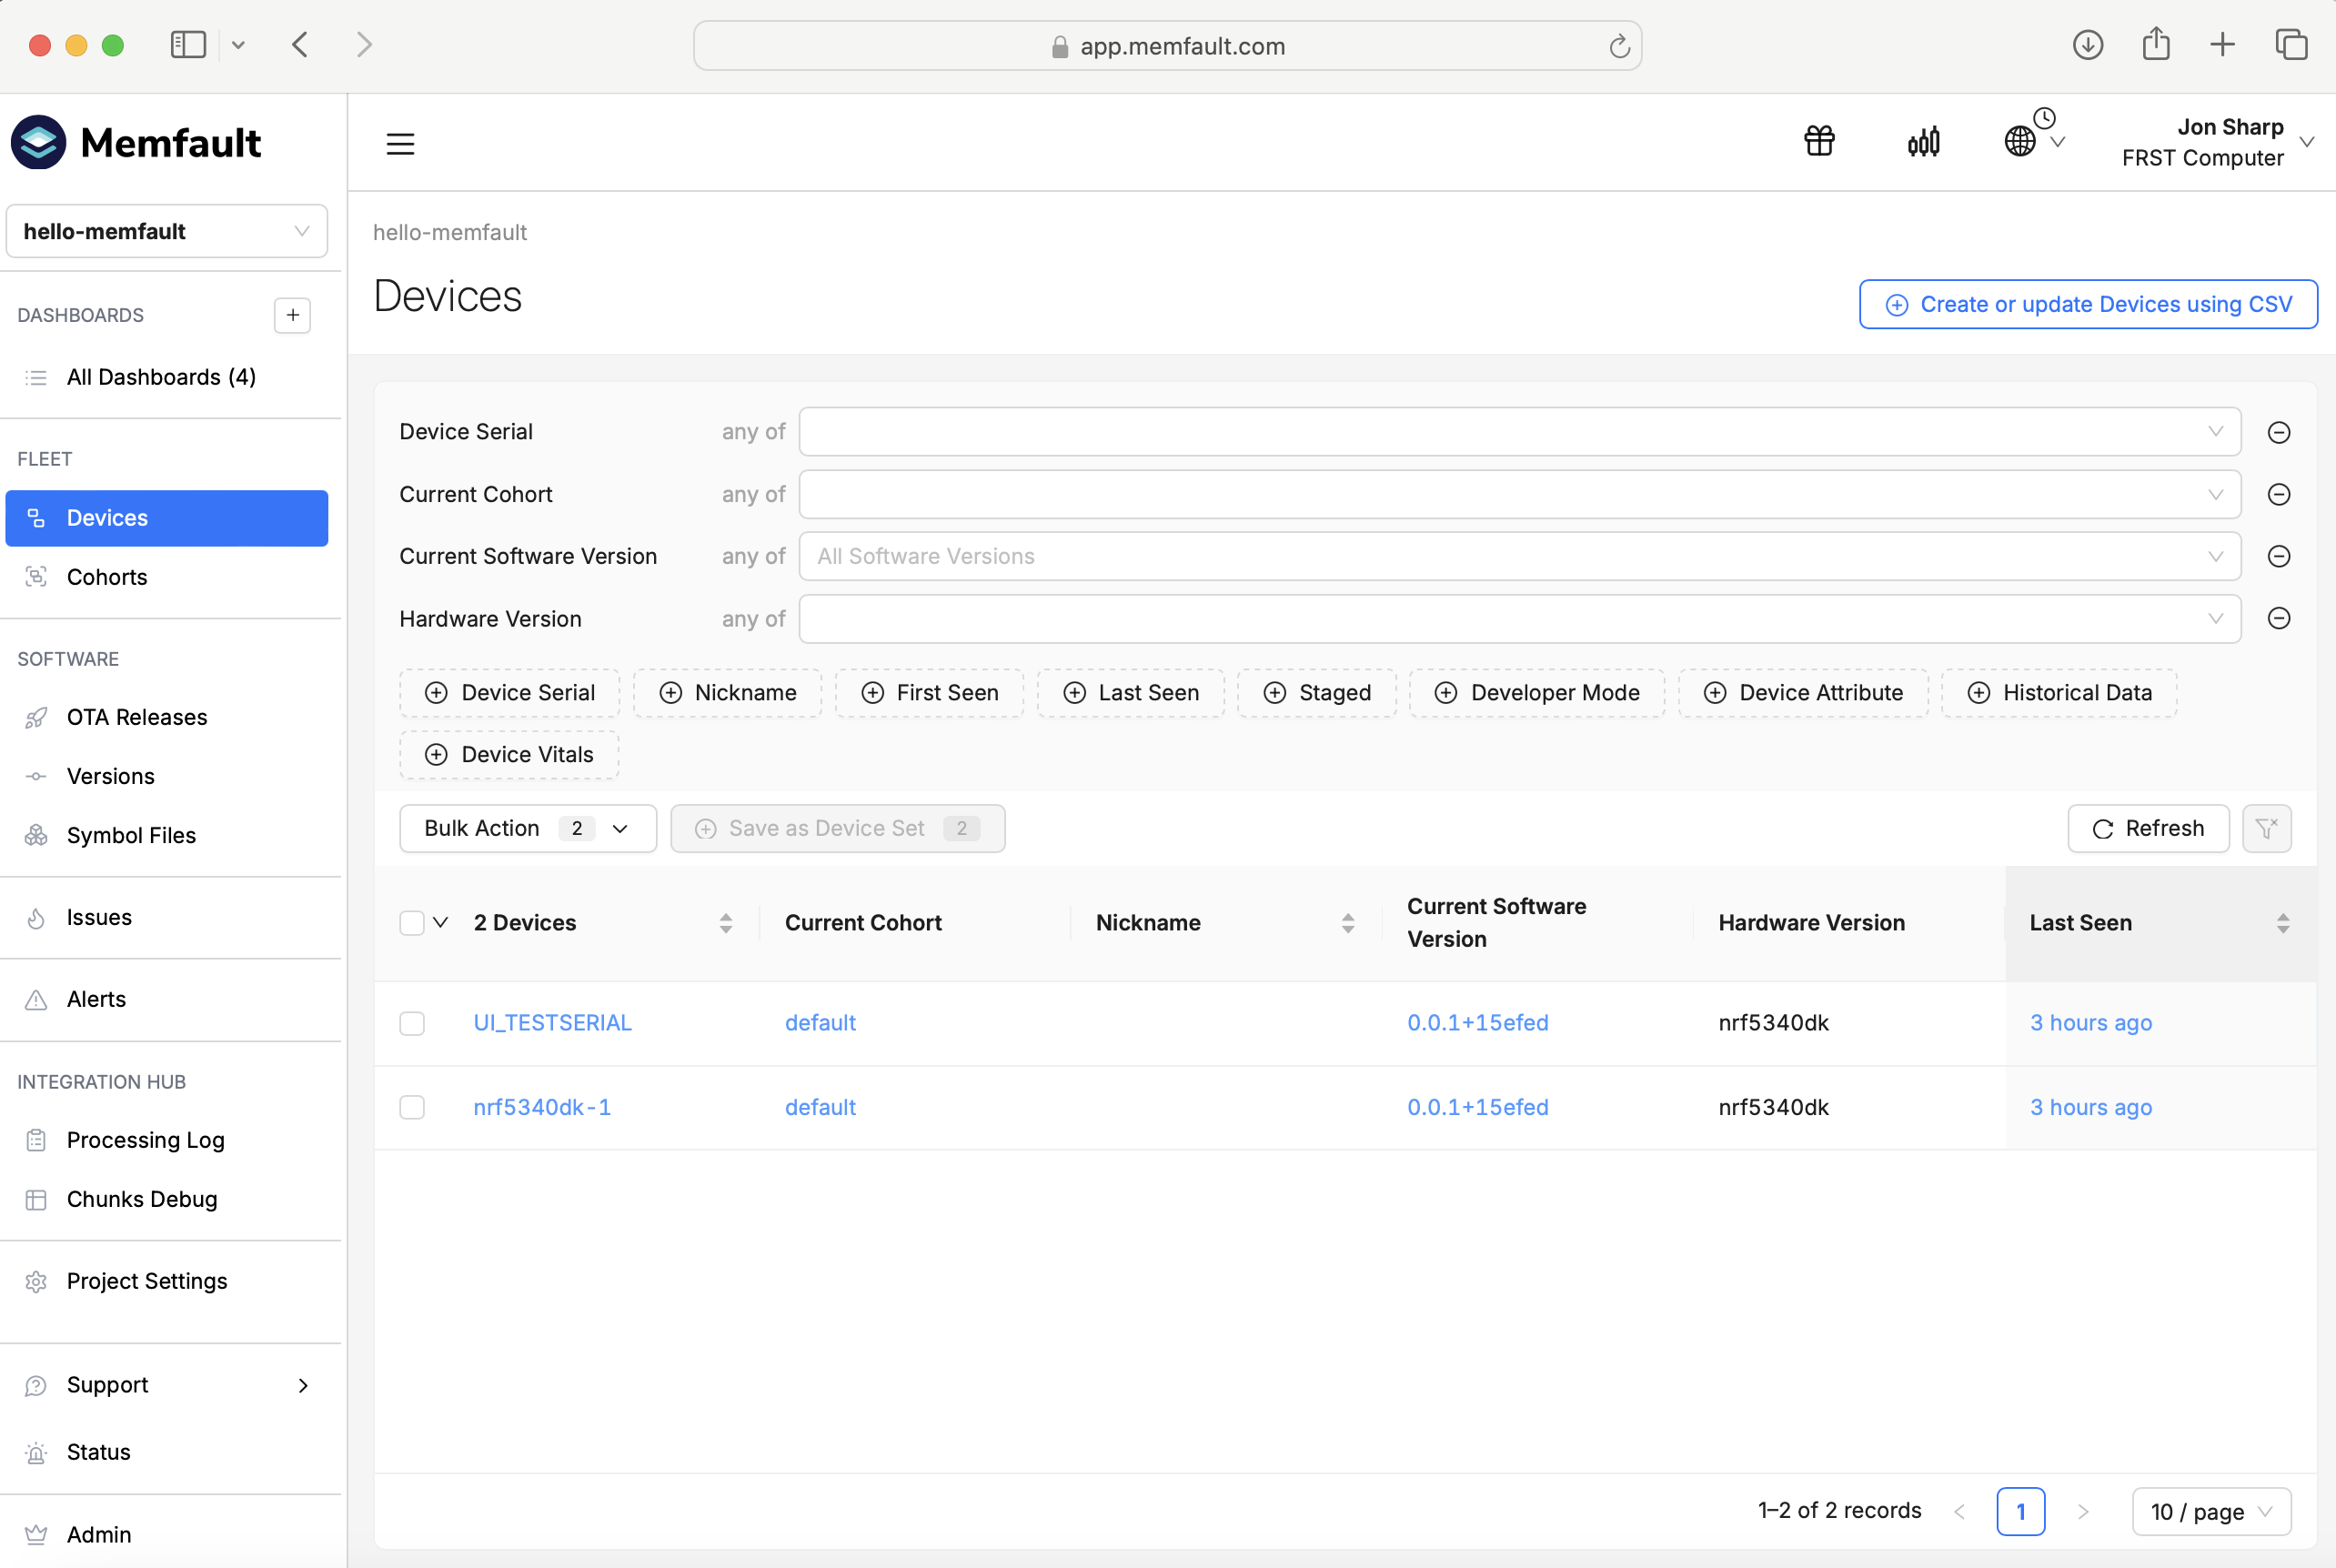
When you’ve completed step 3 of the ‘import chunks’ process, navigate to the Devices view. And now, voila! You should see your device listed there.
12. Explore the imported data on the Memfault platform.
From here, you can begin to explore the data you’ve just imported.
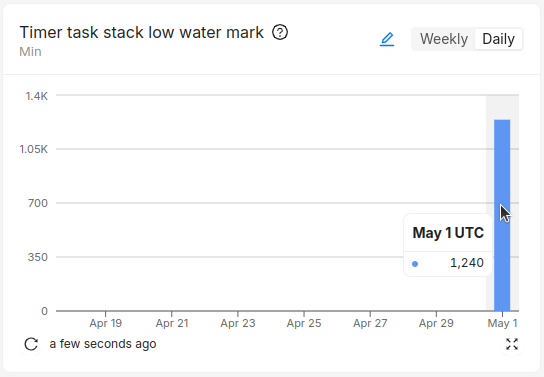
Navigate to the Dashboards → Metrics page and inspect the aggregate metric charts. You may need to refresh the charts using the icon in the bottom left corner of each chart:
We have shown that we can successfully extract metrics from our device. Memfault allows you to see the metrics for a single device on a timeline view, or aggregated and visualized across all devices in charts as shown above.
A powerful feature of Memfault is how easy it is to add a new metric. Doing so is out of scope for this exercise, but it’s as simple as adding the following two lines of code:
Copy
// Add to file config/memfault_metrics_heartbeat_config.defMEMFAULT_METRICS_KEY_DEFINE(temperature_c, kMemfaultMetricType_Signed)// Add in code where the temperature reading is readMEMFAULT_METRIC_SET_SIGNED(temperature_c, get_temperature());
C
Now that we’ve seen some metrics, let’s move on to advanced debugging.
Part 3 – Exploring crash data in Memfault
It’s time to have some fun driving our board into fault territory. Our Memfault shell commands will allow us to provoke those error conditions we hope never to see but are inevitable in our production devices.
We can generate any of these corresponding fault conditions using the following commands:
14. Retrieve the coredump through the Memfault shell commands.
Now what? Well, let’s see if our test assert left a coredump behind:
Copy
uart:~$mfltget_core<inf> mflt: Has coredump with size: 2728
Terminal command
Sure enough, there it is –- 2728 bytes worth of coredump data! The Memfault SDK component of our firmware has stored this data locally for eventual analysis using the Memfault web app.
15. Copy and paste the exported coredump into the Memfault project.
Once again, we’re going to export our coredump data as an encoded bunch of chunks, and upload it to Chunks Debug, just like we did in step 11.
16. Navigate to the Devices page to view the trace.
After you’ve completed the now-familiar chunks import process, navigate to the Devices page.
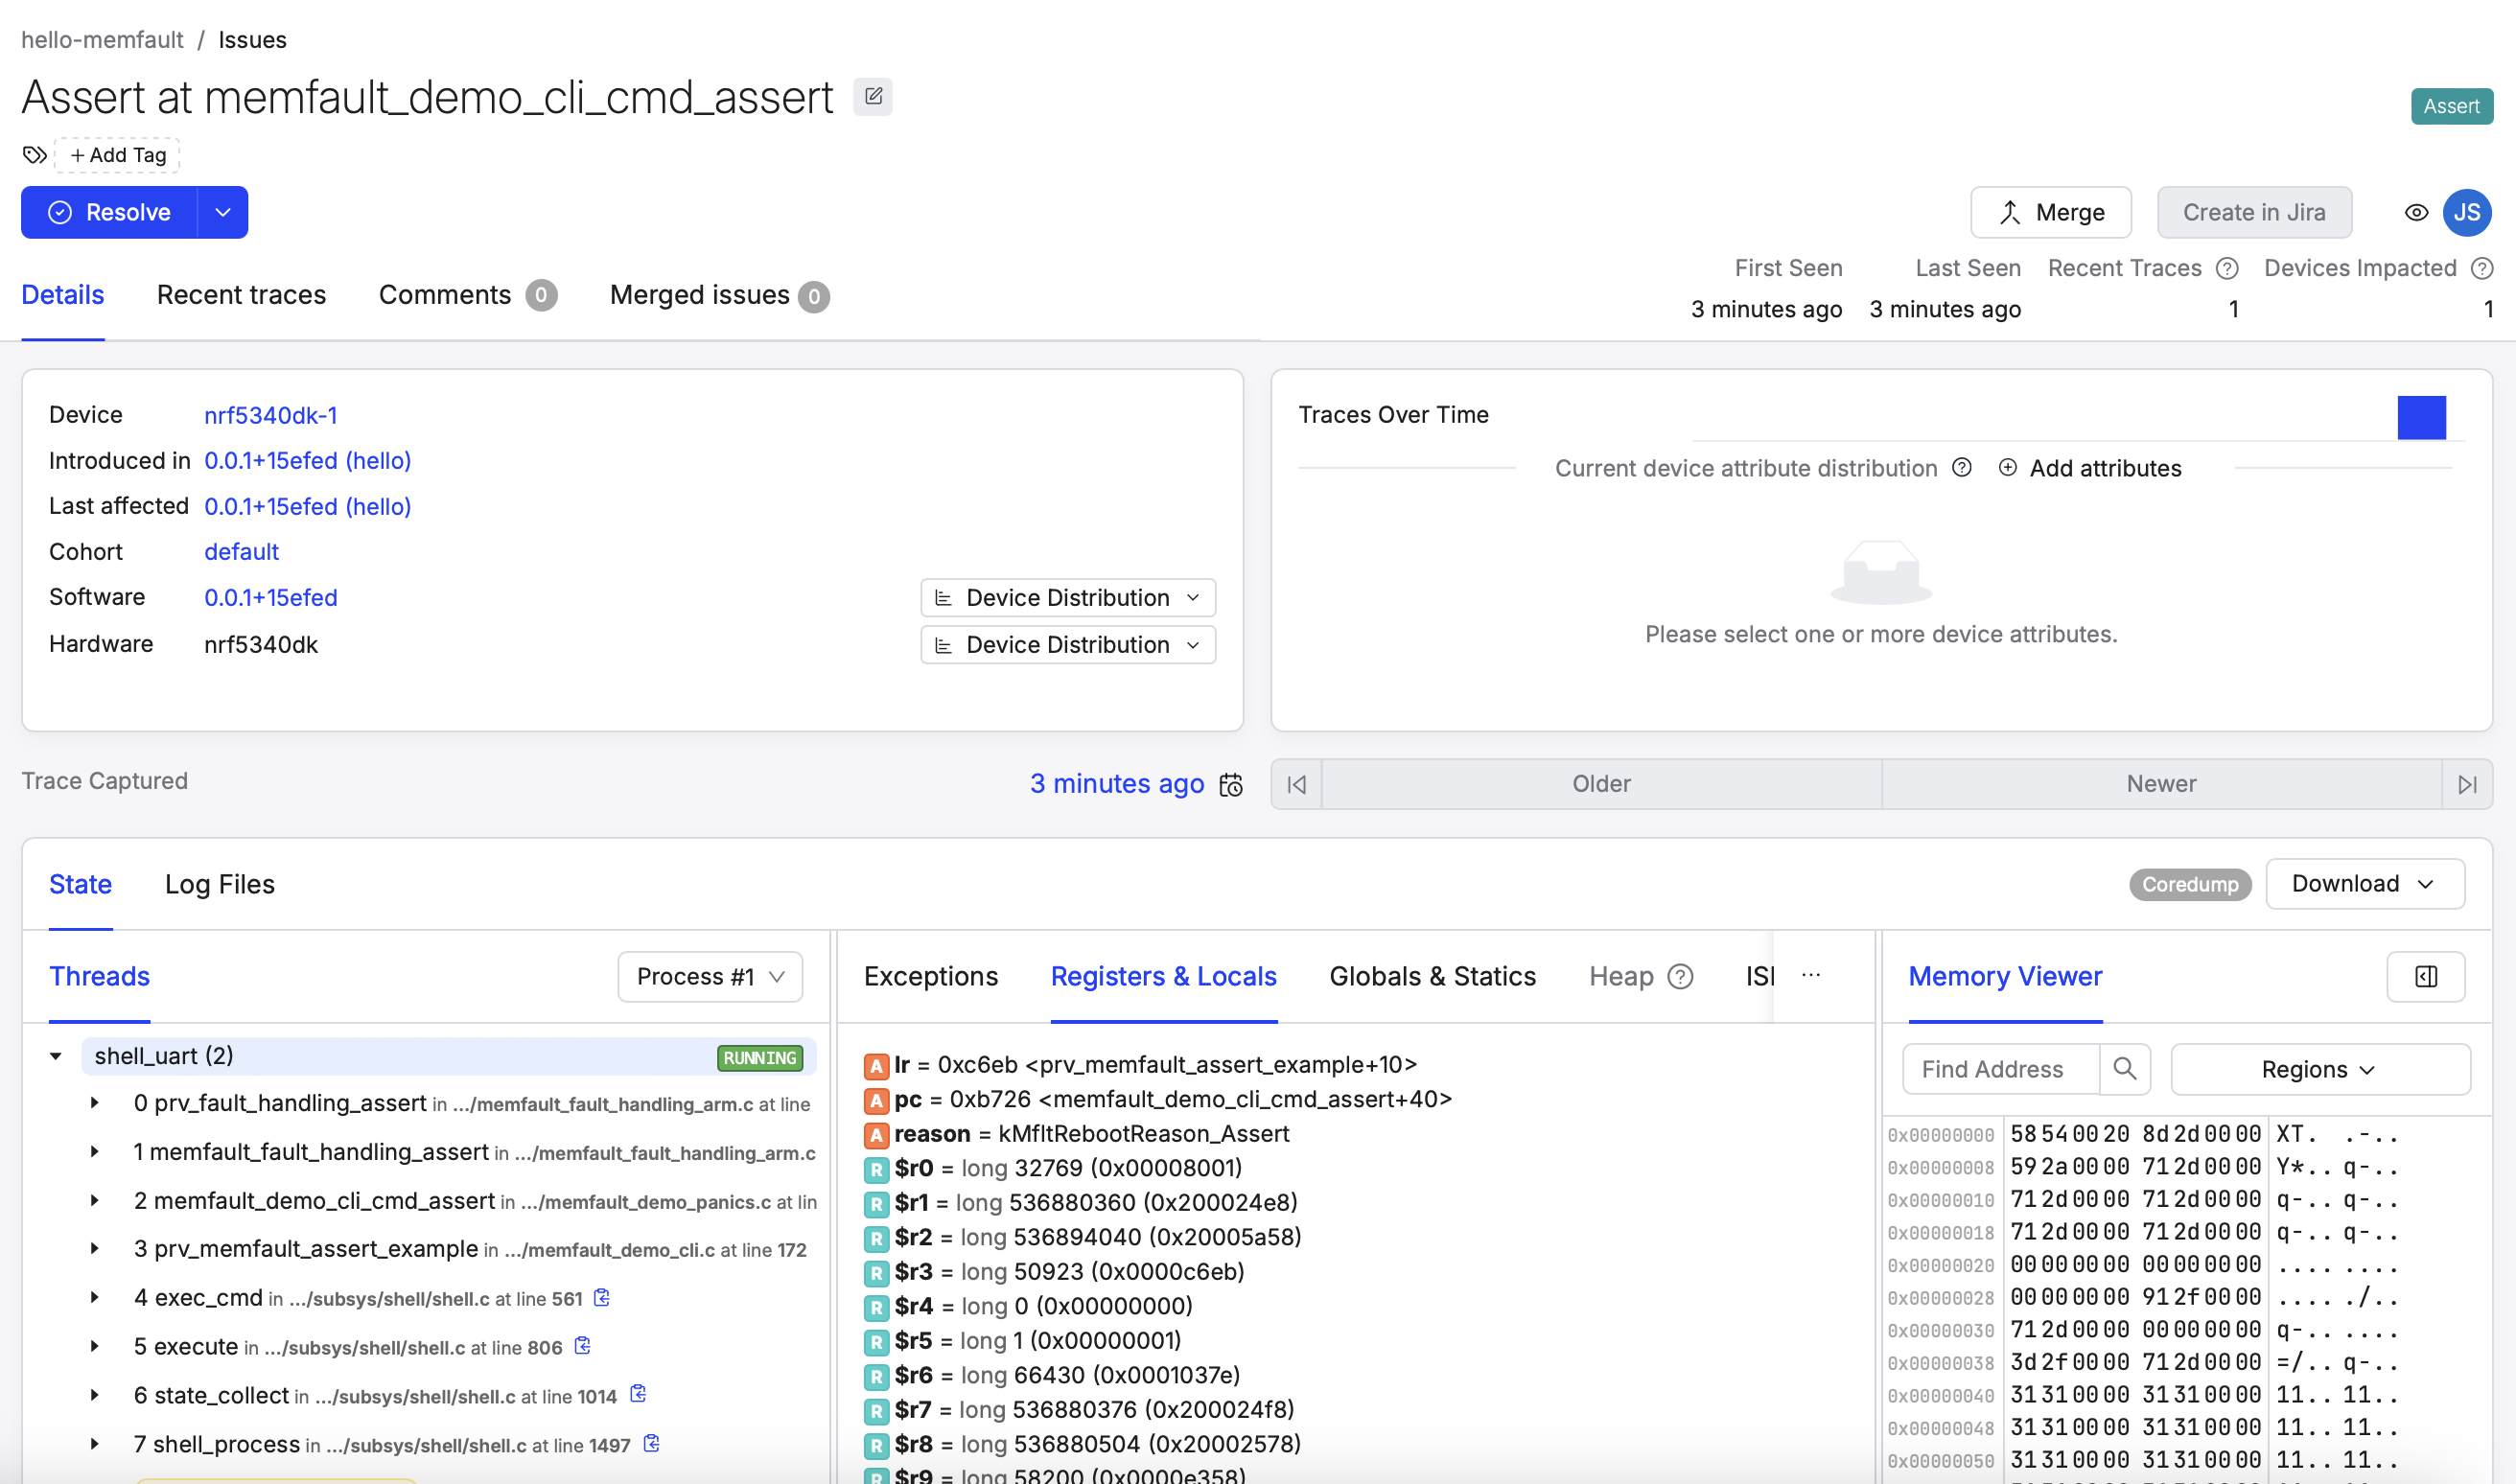
Clicking the device name in this list will bring up the timeline view. From this view, you can either find your coredump in the timeline view under the ‘Traces’ row, or you can navigate to the Traces tab. When you find your trace, click on it, and you will be greeted with a view of the trace that should be familiar to anyone who has stepped through a running firmware with the aid of a debugger and attached JTAG probe. And like your paused debugger, this view represents a complete snapshot of the state of the device at the time of our provoked test crash.
17. Explore the diagnostics view in the Memfault platform.
That looks much better! Now we clearly see where this particular fault occurred in our code. And now that we have our ELF data, we can really explore this fully fleshed-out system state snapshot — starting with the full RTOS thread view that you’ve come to expect in your debugger. Go ahead and peel back the layers on these stack frames. From there, you might want to explore the register values and local variables. The Globals & Statics view has a host of useful Zephyr-related structs that can be invaluable when you need to untangle complicated OS-level behaviors. Lastly, the Memory Viewer exposes the difference between where you thought you put that data and where it actually ended up.
You can imagine how this might look for our naturally occurring firmware faults and how valuable this information will be as our firmware grows up and finds its way into production, far from our desktop debugger.
(Optional) Part 4 – Exploring remote debugging
18. (Optional) Transfer the diagnostic data to the Memfault platform over Bluetooth LE, Wi-Fi or cellular IoT.
Transferring the chunks (diagnostic data) manually from the serial terminal to the Memfault platform was quite convenient during the development phase and while working with development kits. However, it’s not feasible at all for deployed in-field devices. The Memfault SDK, which is fully integrated into the nRF Connect SDK, offers multiple transport options for transferring diagnostic data from remote devices, including Bluetooth LE, Wi-Fi, and cellular IoT.
Depending on the development kit you are using, you can pick the supported transports below
Follow this section if you are using one of the following development kits: nRF9161 DK, nRF9160 DK, nRF9151 DK or nRF7002 DK.
Setting up Memfault on a cellular IoT or Wi-Fi development kit is quite straightforward since the device already has a direct connection to the internet.
The Memfault sample in the nRF Connect SDK shows how to use Memfault to collect coredumps and metrics over a cellular or Wi-Fi connection.
The workflow is simple
Create a new project in Memfault and copy the project key, same as we did earlier in this exercise.
Insert the key in the sample and build/flash the sample to your board.
Follow this section if you are using one of the following development kits: nRF54L15 DK, nRF5340 DK, nRF52840 DK, nRF52833 DK, or nRF52 DK.
It is possible to use Bluetooth LE to forward the diagnostic data collected by the firmware through a Bluetooth gateway, by using the GATT custom service: Memfault Diagnostic Service (MDS).
The Peripheral MDS sample in the nRF Connect SDK shows you how to use the Memfault Diagnostic Service to collect core dumps and metrics over Bluetooth LE using different Bluetooth gateway options. You can, for example, use the nRF Memfault mobile app (nRF Memfault for Android or nRF Memfault for iOS).
The workflow is simple:
Create a new project in Memfault and copy the project key, same as we did earlier in this exercise.
Insert the key in the sample and build/flash the sample to your board.
We registered an account and created an nRF MCU project in the Memfault platform
We activated the Memfault SDK components in our nRF Connect SDK application.
We crashed our firmware
We imported the trace data into our project
We uploaded our ELF symbol data
We took a closer look at our fully symbolicated trace
In our short session, we’ve equipped our firmware with powerful remote debugging capabilities. Having this functionality enabled from the beginning of your project will allow you to observe the performance of the firmware over the releases that follow. As an embedded engineer, you will be equipped with new insights, confidently adding features to your firmware as it goes from development into production.
Ultimately, when remote debugging is combined with some kind of periodic data connectivity path, custom metrics, fleet segmentation, and OTA (over-the-air) functionality, embedded development teams can perform proactive release monitoring — equipped with the data to ensure firmware quality.
Nordic Developer Academy Privacy Policy
1. Introduction
In this Privacy Policy you will find information on Nordic Semiconductor ASA (“Nordic Semiconductor”) processes your personal data when you use the Nordic Developer Academy.
References to “we” and “us” in this document refers to Nordic Semiconductor.
2. Our processing of personal data when you use the Nordic Developer Academy
2.1 Nordic Developer Academy
Nordic Semiconductor processes personal data in order to provide you with the features and functionality of the Nordic Developer Academy. Creating a user account is optional, but required if you want to track you progress and view your completed courses and obtained certificates. If you choose to create a user account, we will process the following categories of personal data:
Email
Name
Password (encrypted)
Course progression (e.g. which course you have completely or partly completed)
Certificate information, which consists of name of completed course and the validity of the certificate
Course results
During your use of the Nordic Developer Academy, you may also be asked if you want to provide feedback. If you choose to respond to any such surveys, we will also process the personal data in your responses in that survey.
The legal basis for this processing is GDPR article 6 (1) b. The processing is necessary for Nordic Semiconductor to provide the Nordic Developer Academy under the Terms of Service.
2.2 Analytics
If you consent to analytics, Nordic Semiconductor will use Google Analytics to obtain statistics about how the Nordic Developer Academy is used. This includes collecting information on for example what pages are viewed, the duration of the visit, the way in which the pages are maneuvered, what links are clicked, technical information about your equipment. The information is used to learn how Nordic Developer Academy is used and how the user experience can be further developed.
2.2 Newsletter
You can consent to receive newsletters from Nordic from within the Nordic Developer Academy. How your personal data is processed when you sign up for our newsletters is described in the Nordic Semiconductor Privacy Policy.
3. Retention period
We will store your personal data for as long you use the Nordic Developer Academy. If our systems register that you have not used your account for 36 months, your account will be deleted.
4. Additional information
Additional information on how we process personal data can be found in the Nordic Semiconductor Privacy Policy and Cookie Policy.
Nordic Developer Academy Terms of Service
1. Introduction
These terms and conditions (“Terms of Use”) apply to the use of the Nordic Developer Academy, provided by Nordic Semiconductor ASA, org. nr. 966 011 726, a public limited liability company registered in Norway (“Nordic Semiconductor”).
Nordic Developer Academy allows the user to take technical courses related to Nordic Semiconductor products, software and services, and obtain a certificate certifying completion of these courses. By completing the registration process for the Nordic Developer Academy, you are agreeing to be bound by these Terms of Use.
These Terms of Use are applicable as long as you have a user account giving you access to Nordic Developer Academy.
2. Access to and use of Nordic Developer Academy
Upon acceptance of these Terms of Use you are granted a non-exclusive right of access to, and use of Nordic Developer Academy, as it is provided to you at any time. Nordic Semiconductor provides Nordic Developer Academy to you free of charge, subject to the provisions of these Terms of Use and the Nordic Developer Academy Privacy Policy.
To access select features of Nordic Developer Academy, you need to create a user account. You are solely responsible for the security associated with your user account, including always keeping your login details safe.
You will able to receive an electronic certificate from Nordic Developer Academy upon completion of courses. By issuing you such a certificate, Nordic Semiconductor certifies that you have completed the applicable course, but does not provide any further warrants or endorsements for any particular skills or professional qualifications.
Nordic Semiconductor will continuously develop Nordic Developer Academy with new features and functionality, but reserves the right to remove or alter any existing functions without notice.
3. Acceptable use
You undertake that you will use Nordic Developer Academy in accordance with applicable law and regulations, and in accordance with these Terms of Use. You must not modify, adapt, or hack Nordic Developer Academy or modify another website so as to falsely imply that it is associated with Nordic Developer Academy, Nordic Semiconductor, or any other Nordic Semiconductor product, software or service.
You agree not to reproduce, duplicate, copy, sell, resell or in any other way exploit any portion of Nordic Developer Academy, use of Nordic Developer Academy, or access to Nordic Developer Academy without the express written permission by Nordic Semiconductor. You must not upload, post, host, or transmit unsolicited email, SMS, or \”spam\” messages.
You are responsible for ensuring that the information you post and the content you share does not;
contain false, misleading or otherwise erroneous information
infringe someone else’s copyrights or other intellectual property rights
contain sensitive personal data or
contain information that might be received as offensive or insulting.
Such information may be removed without prior notice.
Nordic Semiconductor reserves the right to at any time determine whether a use of Nordic Developer Academy is in violation of its requirements for acceptable use.
Violation of the at any time applicable requirements for acceptable use may result in termination of your account. We will take reasonable steps to notify you and state the reason for termination in such cases.
4. Routines for planned maintenance
Certain types of maintenance may imply a stop or reduction in availability of Nordic Developer Academy. Nordic Semiconductor does not warrant any level of service availability but will provide its best effort to limit the impact of any planned maintenance on the availability of Nordic Developer Academy.
5. Intellectual property rights
Nordic Semiconductor retains all rights to all elements of Nordic Developer Academy. This includes, but is not limited to, the concept, design, trademarks, know-how, trade secrets, copyrights and all other intellectual property rights.
Nordic Semiconductor receives all rights to all content uploaded or created in Nordic Developer Academy. You do not receive any license or usage rights to Nordic Developer Academy beyond what is explicitly stated in this Agreement.
6. Liability and damages
Nothing within these Terms of Use is intended to limit your statutory data privacy rights as a data subject, as described in the Nordic Developer Academy Privacy Policy. You acknowledge that errors might occur from time to time and waive any right to claim for compensation as a result of errors in Nordic Developer Academy. When an error occurs, you shall notify Nordic Semiconductor of the error and provide a description of the error situation.
You agree to indemnify Nordic Semiconductor for any loss, including indirect loss, arising out of or in connection with your use of Nordic Developer Academy or violations of these Terms of Use. Nordic Semiconductor shall not be held liable for, and does not warrant that (i) Nordic Developer Academy will meet your specific requirements, (ii) Nordic Developer Academy will be uninterrupted, timely, secure, or error-free, (iii) the results that may be obtained from the use of Nordic Developer Academy will be accurate or reliable, (iv) the quality of any products, services, information, or other material purchased or obtained by you through Nordic Developer Academy will meet your expectations, or that (v) any errors in Nordic Developer Academy will be corrected.
You accept that this is a service provided to you without any payment and hence you accept that Nordic Semiconductor will not be held responsible, or liable, for any breaches of these Terms of Use or any loss connected to your use of Nordic Developer Academy. Unless otherwise follows from mandatory law, Nordic Semiconductor will not accept any such responsibility or liability.
7. Change of terms
Nordic Semiconductor may update and change the Terms of Use from time to time. Nordic Semiconductor will seek to notify you about significant changes before such changes come into force and give you a possibility to evaluate the effects of proposed changes. Continued use of Nordic Developer Academy after any such changes shall constitute your acceptance of such changes. You can review the current version of the Terms of Use at any time at https://academy.nordicsemi.com/terms-of-service/
8. Transfer of rights
Nordic Semiconductor is entitled to transfer its rights and obligation pursuant to these Terms of Use to a third party as part of a merger or acquisition process, or as a result of other organizational changes.
9. Third Party Services
To the extent Nordic Developer Academy facilitates access to services provided by a third party, you agree to comply with the terms governing such third party services. Nordic Semiconductor shall not be held liable for any errors, omissions, inaccuracies, etc. related to such third party services.
10. Dispute resolution
The Terms of Use and any other legally binding agreement between yourself and Nordic Semiconductor shall be subject to Norwegian law and Norwegian courts’ exclusive jurisdiction.